This guide covers FlexiSurvey's analytics and reporting — everything from a quick at-a-glance summary of a survey to formal statistical tests, automated insights, and exports for SPSS or Excel. It's written for analysts and programme managers who need to turn responses into findings.
Core analytics are available on every plan; the heavier statistical and AI tooling is most useful once you have a meaningful number of responses.
Quickstart: Analyze your results
Follow these steps in the product:
Once responses start arriving, FlexiSurvey turns them into insight. This guide walks through the survey analytics overview, the advanced statistical workspace, and AI-generated insights — all on a survey with real responses.
1. Survey analytics overview
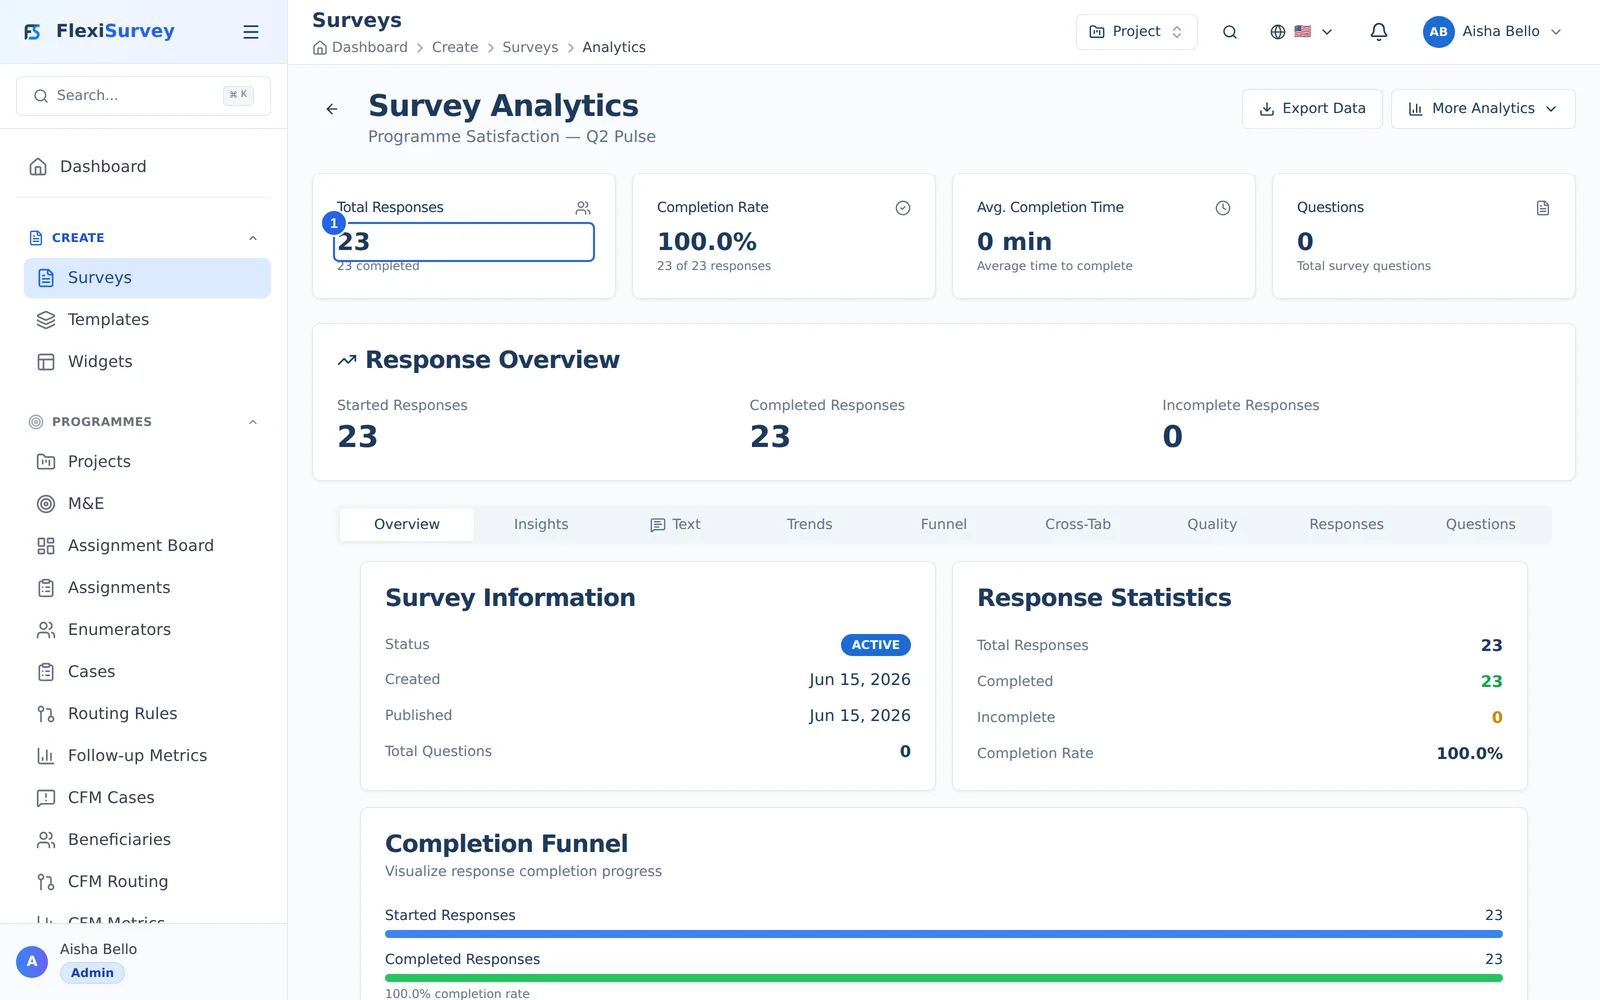
Each survey has a live analytics dashboard: response totals and completion rate, response trends over time, status breakdowns, and per-question results — updating as new responses come in. NPS, CSAT, and distribution charts render automatically for rating questions.
2. Advanced statistical analysis
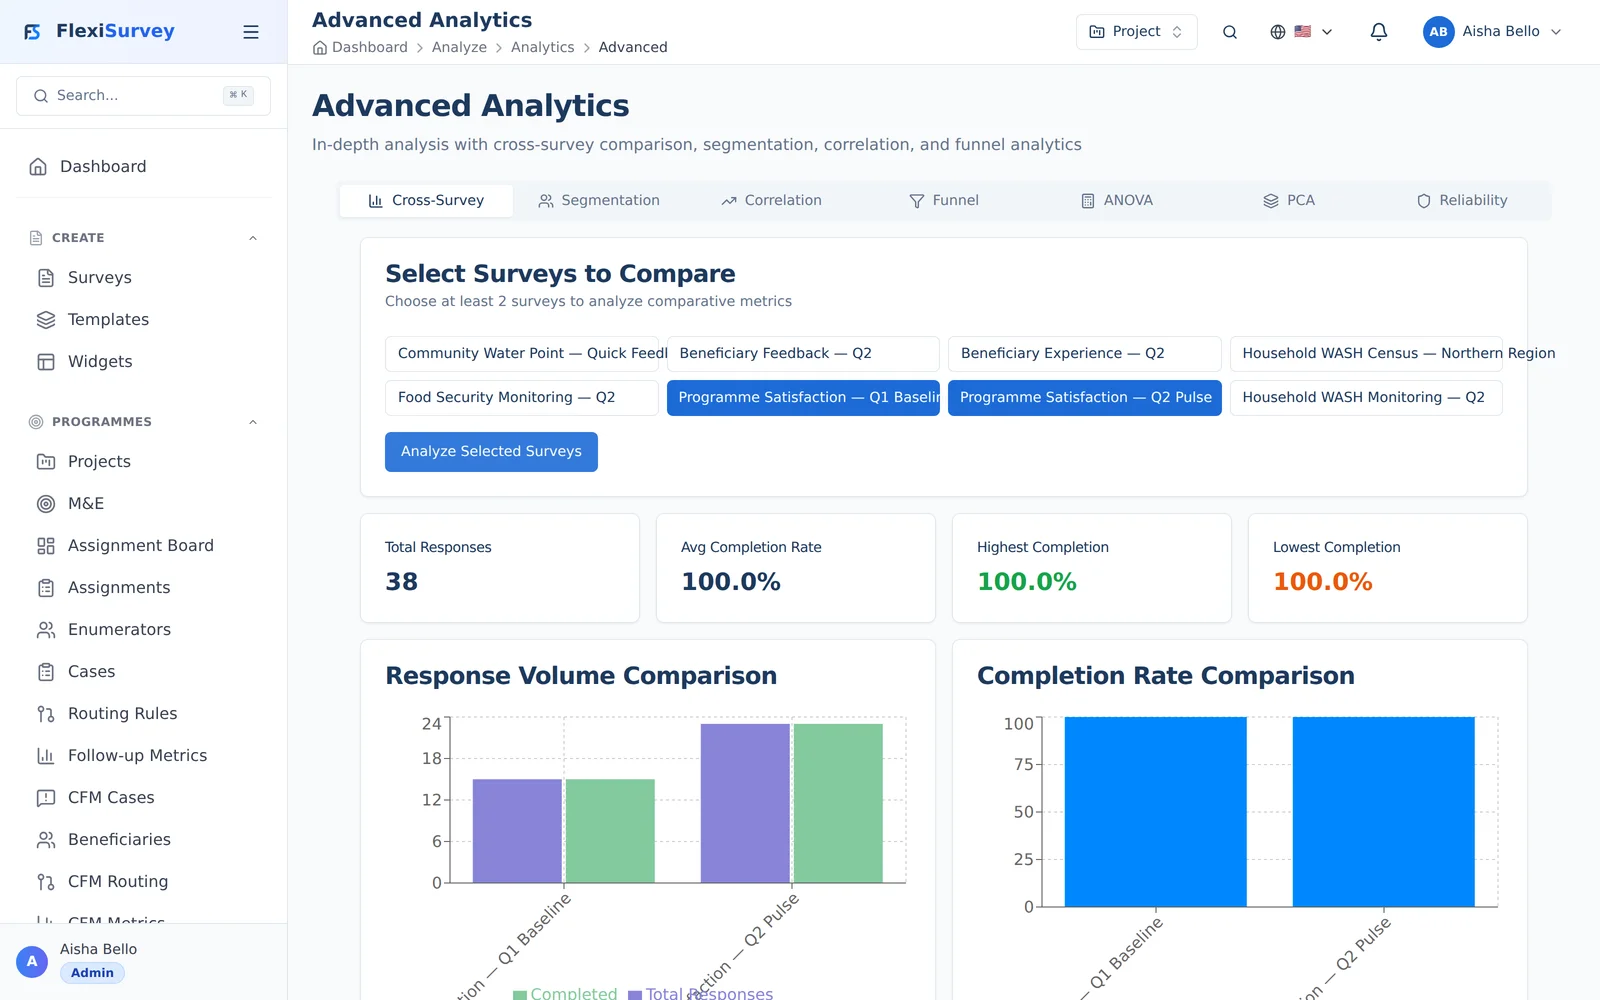
The advanced workspace goes deeper, with a tab for each method — cross-survey comparison, segmentation, correlation, funnel and drop-off, ANOVA, PCA, and reliability. Here two surveys are compared side by side: response volumes and completion rates plotted together, so you can benchmark a follow-up round against the baseline. These are real statistics you can defend to a donor or board, not just counts.
3. AI-driven insights
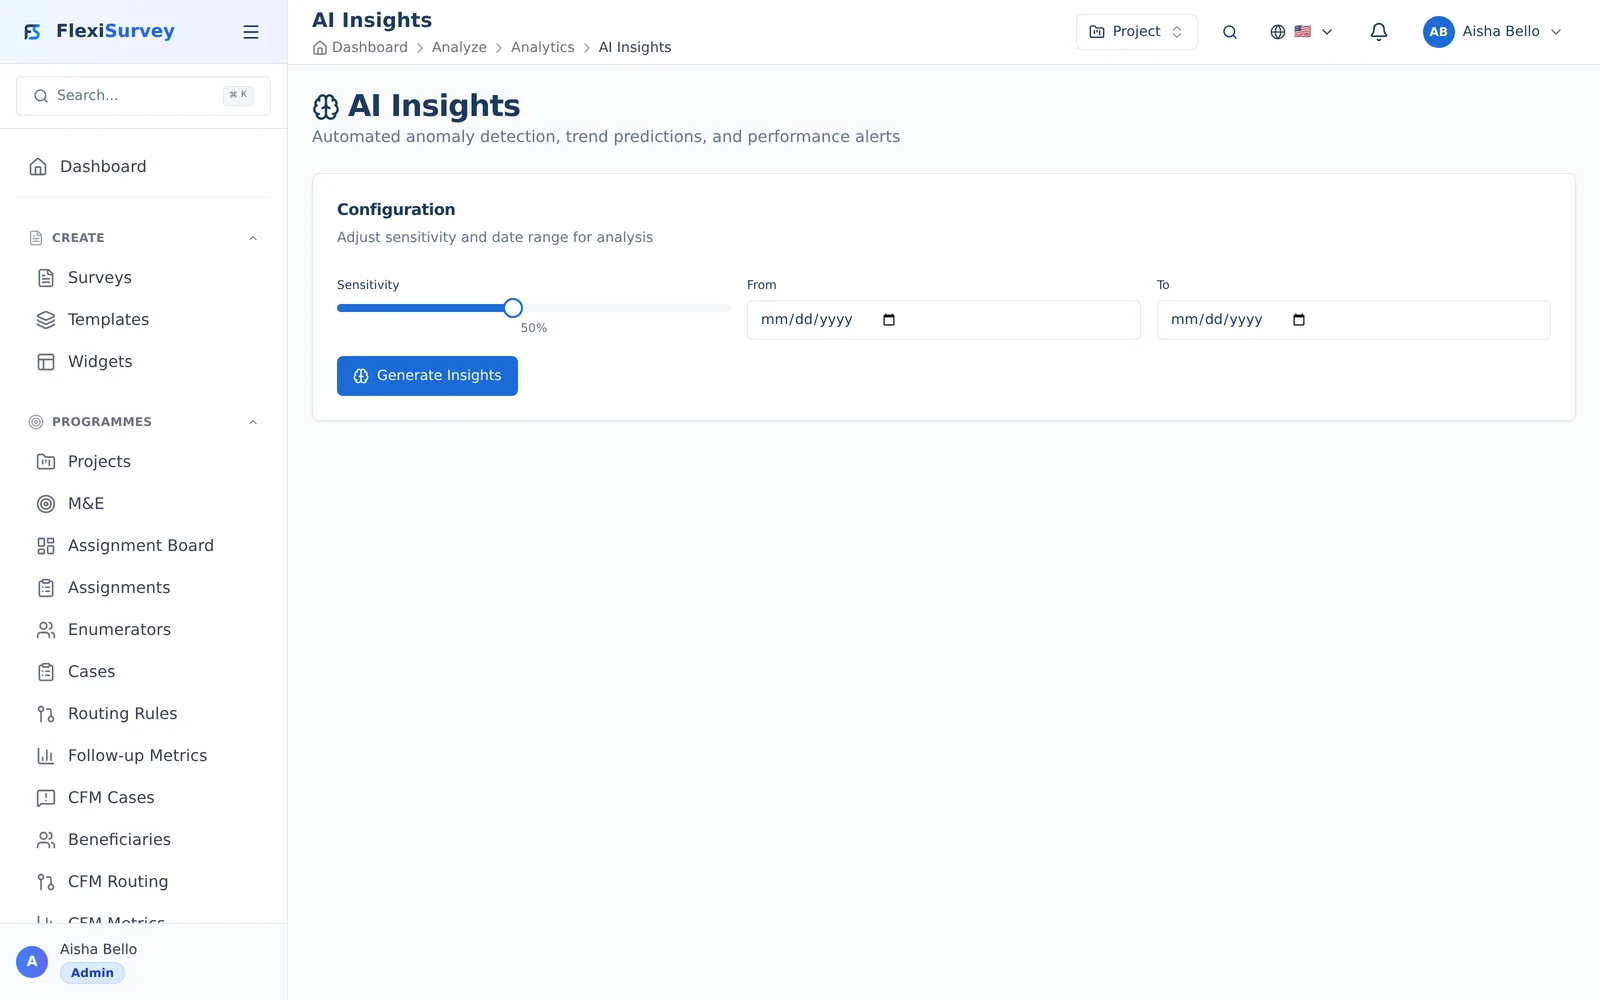
AI insights run on demand: set the sensitivity and date range, then Generate to surface what's notable automatically — anomalies, trend predictions, engagement patterns, and a weighted health score — turning raw responses into a short list of things worth acting on.
The analytics overview
Every survey has an analytics overview — the first place to look once responses come in.
It summarises response volume and completion, breaks down each question's answers, and surfaces response timing and drop-off — where respondents abandon a survey — so you can see both what people answered and how they moved through the instrument.
NPS and rating analysis
For satisfaction and loyalty surveys, FlexiSurvey computes Net Promoter Score (NPS) directly:
- the Promoters / Passives / Detractors split and the headline score;
- NPS trend over time;
- segment comparison — NPS by district, channel, or any segment;
- driver analysis — which other questions correlate with the score;
- benchmarks against industry reference points.
Statistical analysis
When you need rigour beyond averages, the statistical analysis tools provide proper inferential statistics.
| Tool | Use it for |
|---|---|
| Descriptive statistics | Mean, median, mode, standard deviation, quartiles, skewness, kurtosis |
| Confidence intervals | 90% / 95% / 99% intervals around an estimate |
| T-test (Welch's) | Comparing the means of two groups |
| Mann-Whitney U | Comparing two groups without assuming a normal distribution |
| Chi-square | Association between categorical variables |
| Correlation (Pearson / Spearman) | How strongly two questions move together |
| Power analysis | The sample size needed to detect an effect |
You can compare groups directly and produce a correlation matrix across a survey's questions.
AI-driven insights
The AI insights view does the first pass of analysis for you.
- Anomaly detection flags unusual spikes or dips.
- Trend analysis fits a line and projects a short forecast.
- Performance alerts warn on low completion or response rates.
- Engagement patterns reveal the best days and times for responses.
- A health score rolls these into a single weighted measure of how a survey is doing.
Sentiment and text analysis
For open-text questions, sentiment analysis classifies responses as positive, neutral, or negative, extracts keywords, builds a word cloud, and groups responses into themes — turning free text into something you can quantify and act on.
Custom dashboards
Build your own dashboards by arranging widgets — charts, scorecards, and summaries — into a saved layout. Dashboards can be duplicated and reused as templates, so a standard programme view can be rolled out across surveys.
Exports
When you need to work outside FlexiSurvey or share raw data, export in the format that fits:
| Format | Best for |
|---|---|
| CSV | Spreadsheets, scripting, import into other tools |
| Excel | Formatted workbooks for stakeholders |
| SPSS | Statistical analysis in SPSS |
| A formatted report to circulate |
Donor-oriented reporting built from M&E indicators (logframe layouts, results frameworks) is covered in the Monitor indicators guide.
Who can do what
- Data Analysts view results, run statistics, build dashboards, and export.
- Data Analyst (aggregated) can analyse aggregated results without seeing raw personal data.
- Viewers can see dashboards and summaries read-only.
Troubleshooting
- A statistic says "not enough data" — tests need a minimum sample; collect more responses or widen the segment.
- NPS isn't showing — NPS needs a 0–10 scale (likelihood-to-recommend) question in the survey.
- An export is missing rows — exports respect your permissions; an aggregated-analyst role won't include raw PII.
- AI insights look thin — anomaly and trend detection improve with more data points over time; some insights are generated on demand.