This guide covers FlexiSurvey's monitoring and evaluation (M&E) tools, written for M&E officers running results-based monitoring against a logframe or theory of change. You'll define indicators, connect them to the questions that feed them, watch results update automatically, and produce donor-ready reports.
Indicators and the results framework are available on the Organisation plan (meIndicators); donor report generation is an Enterprise feature (meDonorReports).
Quickstart: Monitor indicators and report to donors
Follow these steps in the product:
For monitoring & evaluation teams, FlexiSurvey turns survey responses into indicators and donor-ready reports. This guide covers the indicator catalogue, an indicator dashboard, and donor reporting.
1. Your indicator catalogue
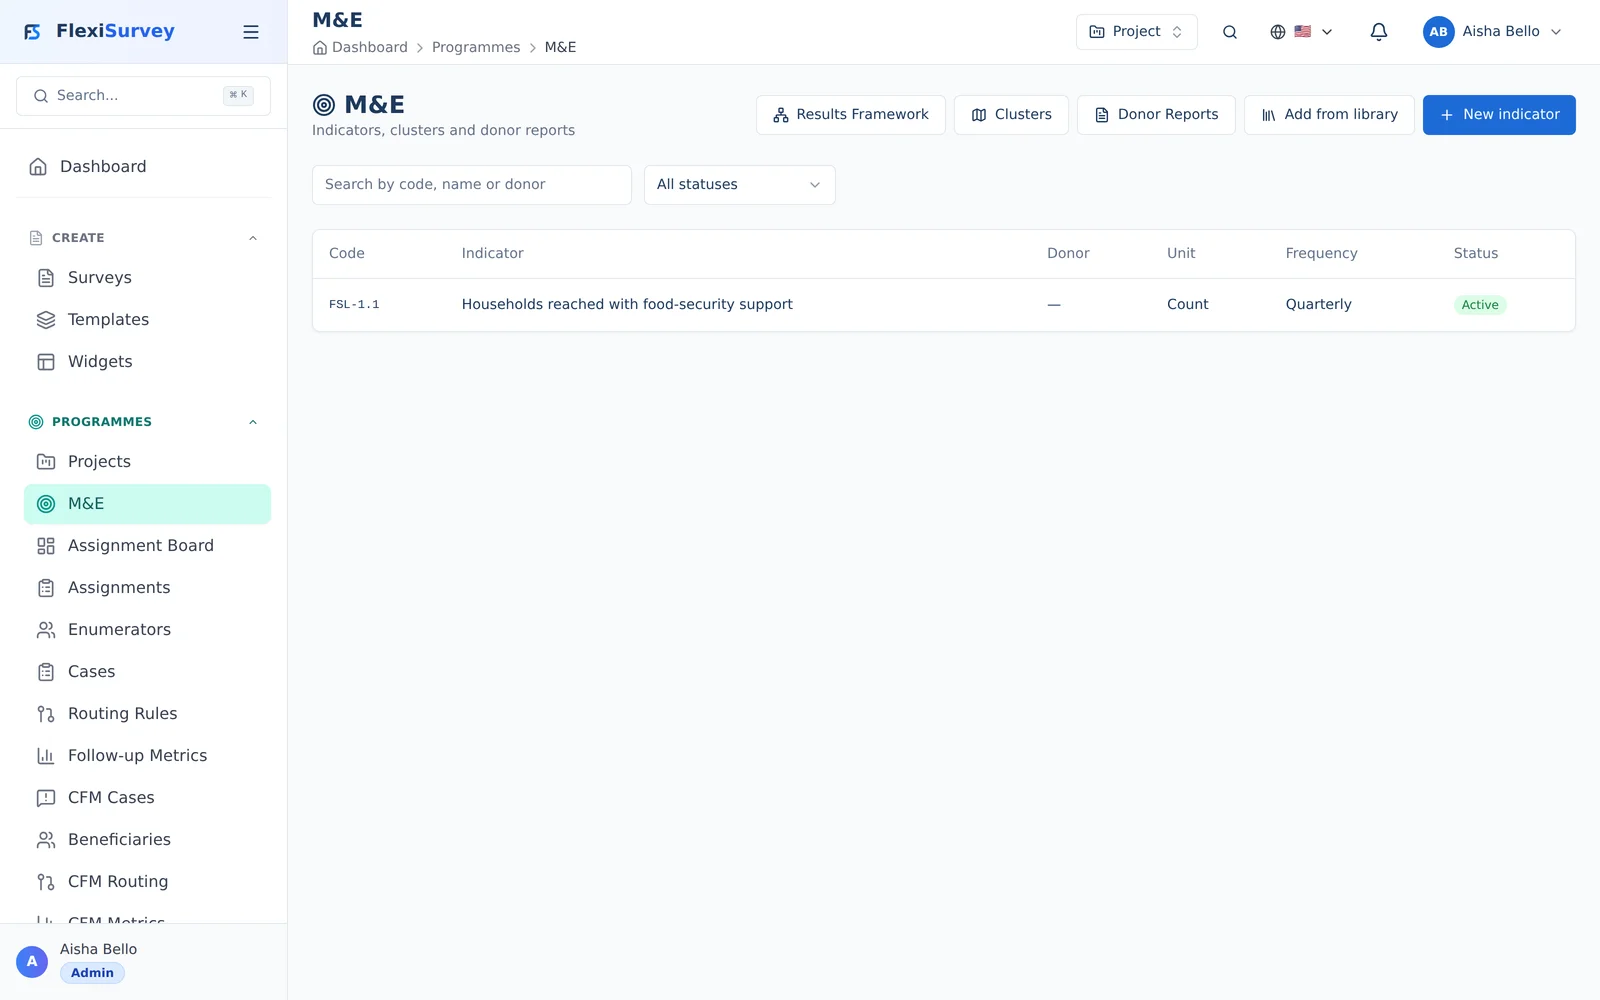
The M&E catalogue lists every indicator in your programme — its code, unit, target, and latest value. Indicators are defined once with a formula and then computed automatically from your survey responses.
2. An indicator dashboard
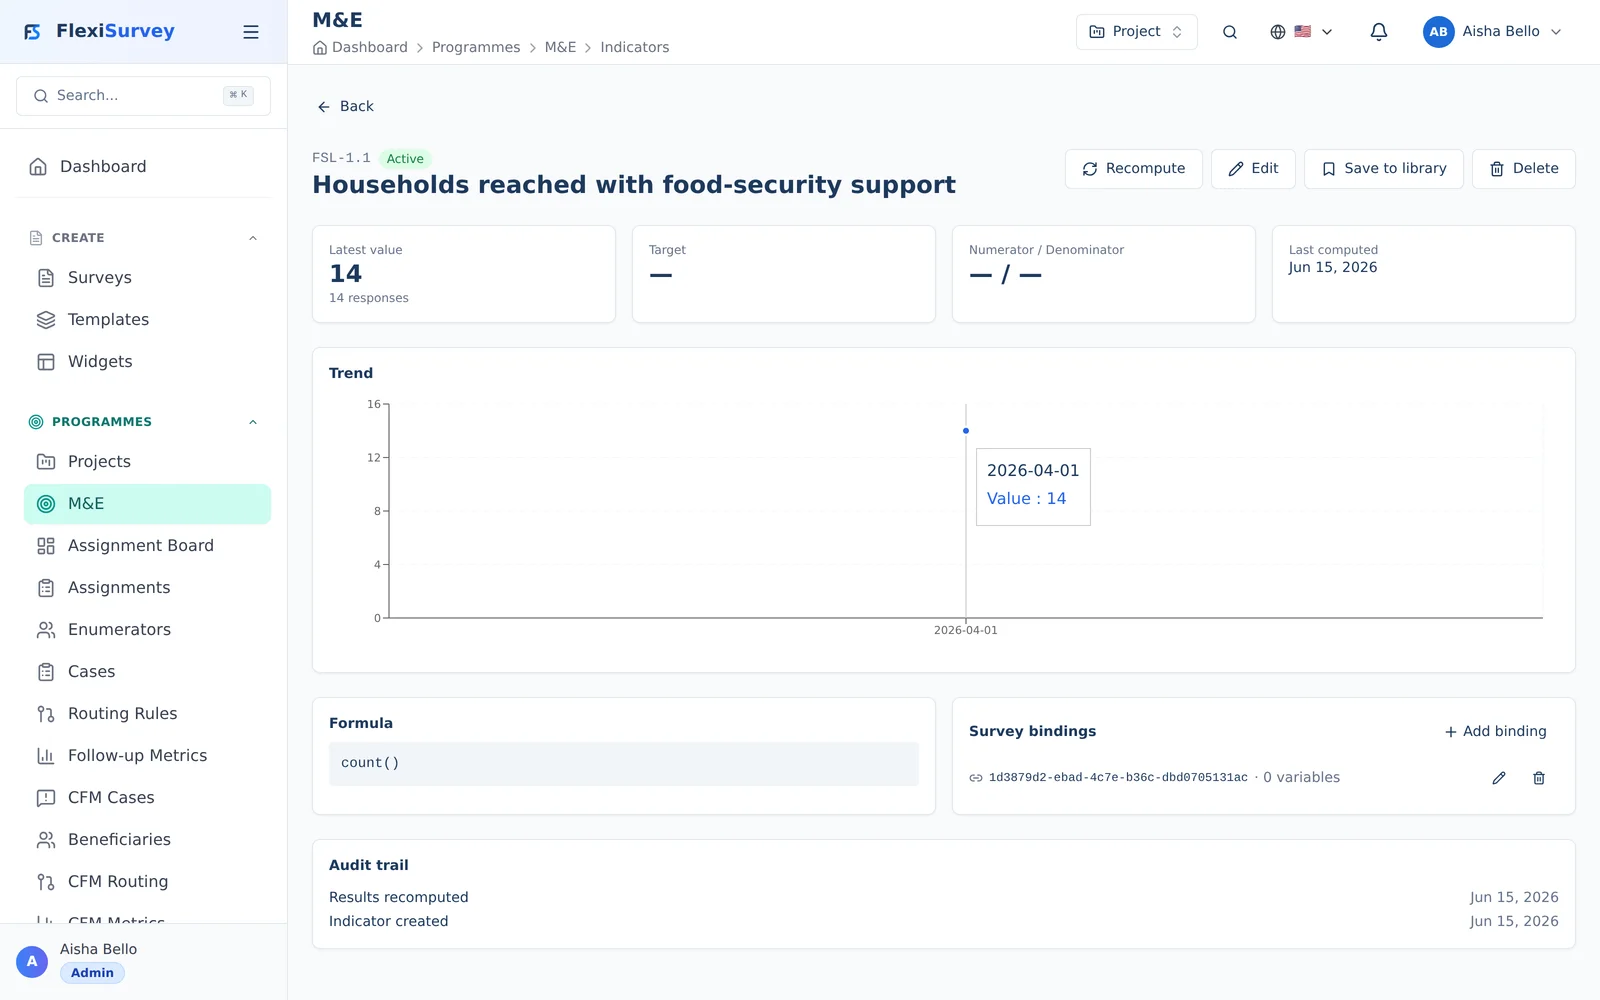
Each indicator has its own dashboard: the latest computed result against target, a trend over time, and a breakdown by disaggregation. The figures update as new responses arrive — no manual spreadsheets.
3. Donor reports
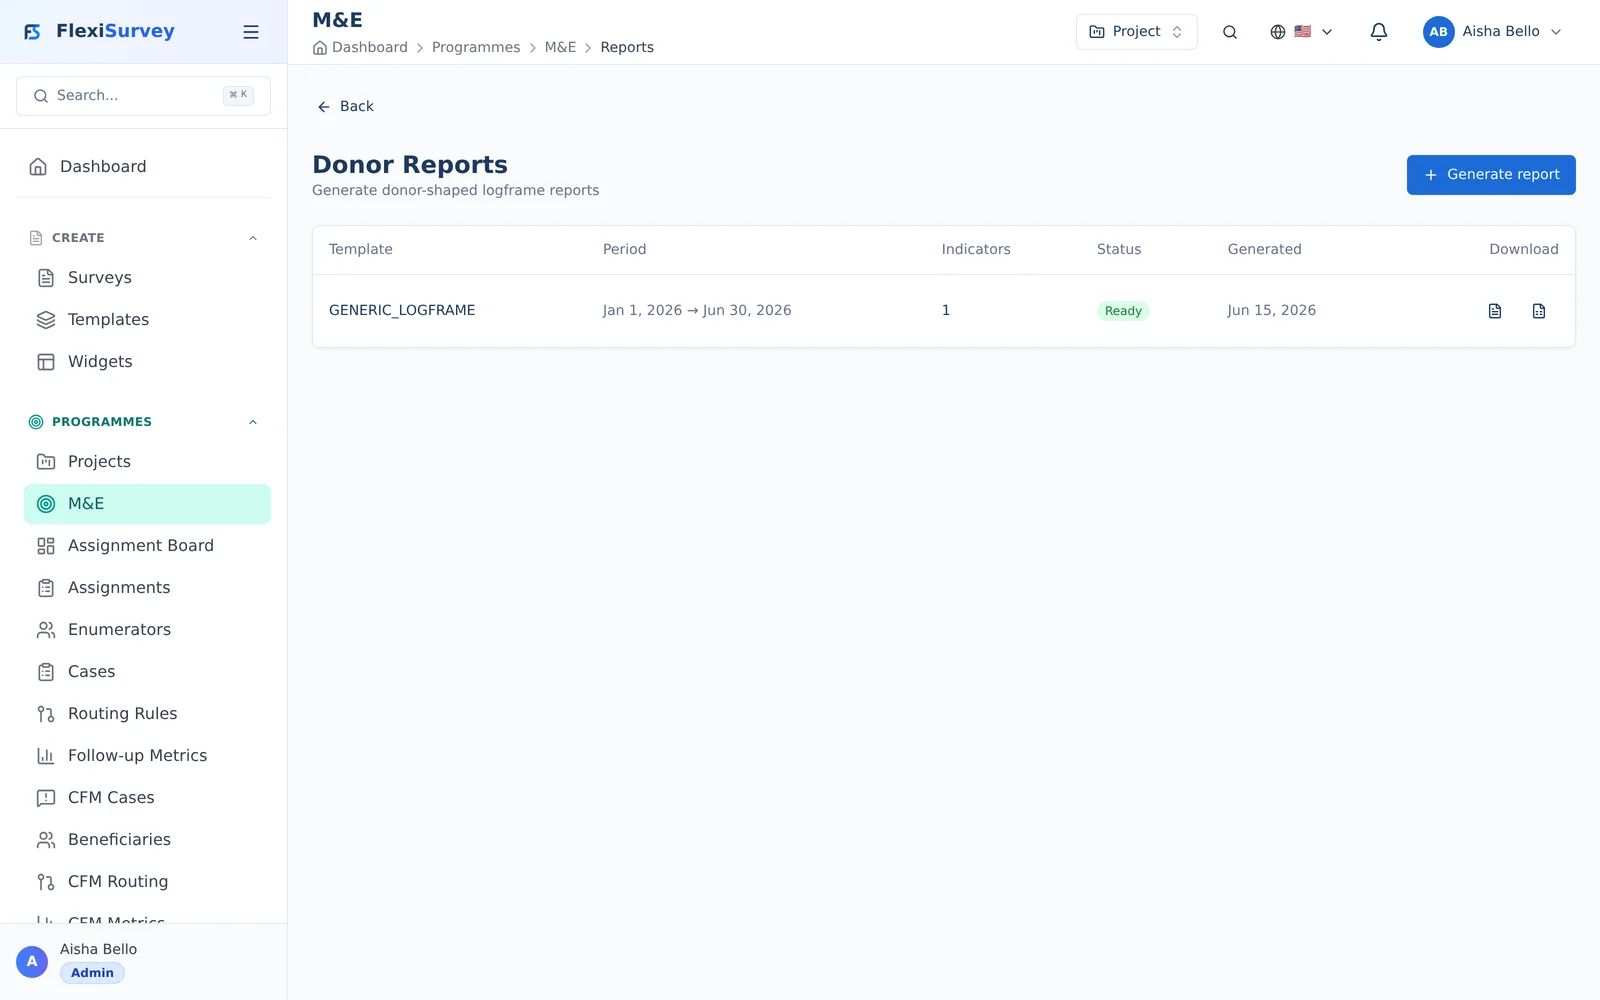
Generate a donor report against a template and reporting period, and FlexiSurvey assembles your indicators, targets, and narratives into a polished PDF or Excel logframe — ready to send to a funder.
The M&E model
FlexiSurvey's M&E layer connects field data to programme results through a few linked concepts:
| Concept | What it is |
|---|---|
| Indicator | A measured value with a unit, target, and direction (e.g. % of households with safe water access) |
| Binding | The rule that computes an indicator from survey answers |
| Result | A computed indicator value for a period and segment, stored and tracked over time |
| Cluster | A geography or organisational unit you measure within (region → district → site) |
| Results framework | A tree of goals/outcomes/outputs that organises indicators (your logframe or ToC) |
Together these let you go from raw responses to a tracked, reportable result without manual spreadsheets.
The indicator catalogue
The catalogue is the home of every indicator in your workspace.
Each indicator carries:
- a name and description;
- a unit — count, percentage, ratio, currency, and so on;
- a target and a direction (whether higher or lower is better), so progress is unambiguous;
- a disaggregation scheme (by sex, age band, district, etc.) for breakdowns.
Starting from the indicator library
You don't have to define every indicator from scratch. The built-in indicator library ships standard indicators grouped into sector packs (WASH, health, food security, protection, and more). Browse the library, instantiate the ones you need into your catalogue, and adjust their targets — or save your own as reusable items. The library can also suggest indicators that fit a survey you've built.
Binding indicators to survey questions
A binding is how an indicator gets its value: it tells FlexiSurvey which survey, which questions, and which formula to use.
In the binding editor you choose a source survey, map its questions to the indicator's variables, and write an aggregate formula — for example count() for a simple tally, or a ratio of two counts for a percentage. The editor includes a live test so you can run the formula against real responses and confirm the number before you save.
The formula language is a small, safe expression DSL — it does not run arbitrary code. It supports counts, sums, averages, ratios, and conditions over the bound answers, with results rounded to six decimal places.
How results stay current
Once an indicator is bound, FlexiSurvey computes and stores its result, and refreshes it automatically (a recompute runs every few hours, and you can trigger one on demand). Results are kept over time, so each indicator builds a history you can chart.
Viewing results: trend and disaggregation
The indicator dashboard shows each indicator against its target, with:
- a trend chart over time, so you can see progress (or regression) at a glance;
- disaggregation breakdowns — the same indicator split by sex, age, district, or whatever scheme you defined;
- an audit trail of how the current value was computed, for transparency and verification.
Clusters: measuring by geography
A cluster is a place or unit you measure within — typically a geographic hierarchy (region → district → site) or an organisational structure. Build the cluster tree from the M&E area, then attach data to clusters so indicators can roll up from site level to programme level. A project represents the programme; clusters represent the geography within it.
Results framework (logframe / theory of change)
The results framework organises your indicators into a hierarchy — goal → outcomes → outputs, or the structure of your theory of change. Build the tree, attach indicators to nodes, and FlexiSurvey rolls results up the framework. This is what turns a flat list of indicators into a coherent logframe that mirrors how donors expect to see results.
Donor reports
When it's time to report, generate a donor report — a formatted document built from your live indicator results.
- Choose a template from the registry (a generic logframe, plus donor-oriented layouts).
- The report can render your results framework as a logframe tree, with each indicator's target, actual, and progress; reports for a flat indicator set fall back to a table.
- Output is generated as PDF or Excel and made available to download.
- Reports snapshot the framework and results at generation time, so a downloaded report is a stable record of that moment.
Donor report generation is an Enterprise feature.
Who can do what
- M&E Officers define indicators, bindings, clusters, and the results framework, and view dashboards.
- Programme Managers and Analysts can view indicator results.
- Indicators require the Organisation plan; donor reports require Enterprise.
Troubleshooting
- An indicator shows no value — confirm it has a binding, the bound survey has responses, and the formula passed its live test.
- The number looks wrong — open the audit trail to see exactly which responses and formula produced it; re-check the question mapping in the binding editor.
- A result looks stale — recompute is periodic; trigger an on-demand recompute, or wait for the next scheduled run.
- Disaggregation is empty — the source survey must capture the disaggregation variable (e.g. a sex or age question) and the binding must map it.
- Donor reports are unavailable — report generation is Enterprise-only; indicators alone are available on Organisation.