Case study · MEAL & programme implementation
Organisation planFrom baseline evidence to final results
Follow one 24-month resilience programme through FlexiSurvey: from results framework and baseline, through field delivery, a data-quality intervention, mid-term adaptation and endline evaluation, to a frozen donor report. Every reported figure stays connected to the indicator, the survey response and the management decision behind it.
The Kijani Household Resilience Programme is a realistic 24-month demonstration supporting 1,200 vulnerable smallholder households across three rural districts and 24 communities, delivered by one implementer working with three local partners. It moves from results framework and baseline, through participant enrolment, field delivery, routine monitoring, complaints and feedback, a formal mid-term review and management adaptation, to an endline evaluation and a final donor report. One programme, not a collection of disconnected screens.
The programme, organisations and figures are fictional demonstration data; the implementation design, workflows, results and setbacks are realistic. Not every indicator is green: a credible programme reaches some targets, partially achieves others and has to explain the difference. Every screen below is the live product. MEAL is available on the Organisation and Enterprise plans; donor reporting is an Enterprise capability.
What you can do
10 pillars, each one expanded further down with bullets and a screenshot.
Results framework
Goal, outcomes, outputs and activities become a living structure, with indicators attached to what they measure.
Baseline collection
Offline collection with GPS and consent; every response lands in one reviewable place.
Field data quality
Flagged interviews, back-checks and rejection: only approved responses feed the numbers.
Indicator definitions
Baseline, target, formula, data source and disaggregation on every indicator. No re-keying.
Decisions & actions
Findings become approved adaptations with an owner, a deadline and completion evidence.
Work-plan delivery
Activities, owners, targets and milestones: delivery kept connected to, but distinct from, outcomes.
Outcome monitoring
Strong delivery, uneven adoption: the northern district flagged at 27% against 45%+ elsewhere.
Mid-term adaptation
Freeze the mid-term snapshot, revise the plan, and keep both the original and the change on record.
Endline comparison
Same districts, same core indicators, baseline–mid-term–endline–target in one comparison.
Frozen donor report
One click freezes approved figures into a PDF and Excel edition that stays traceable to source.
1. Turn the approved proposal into a working programme
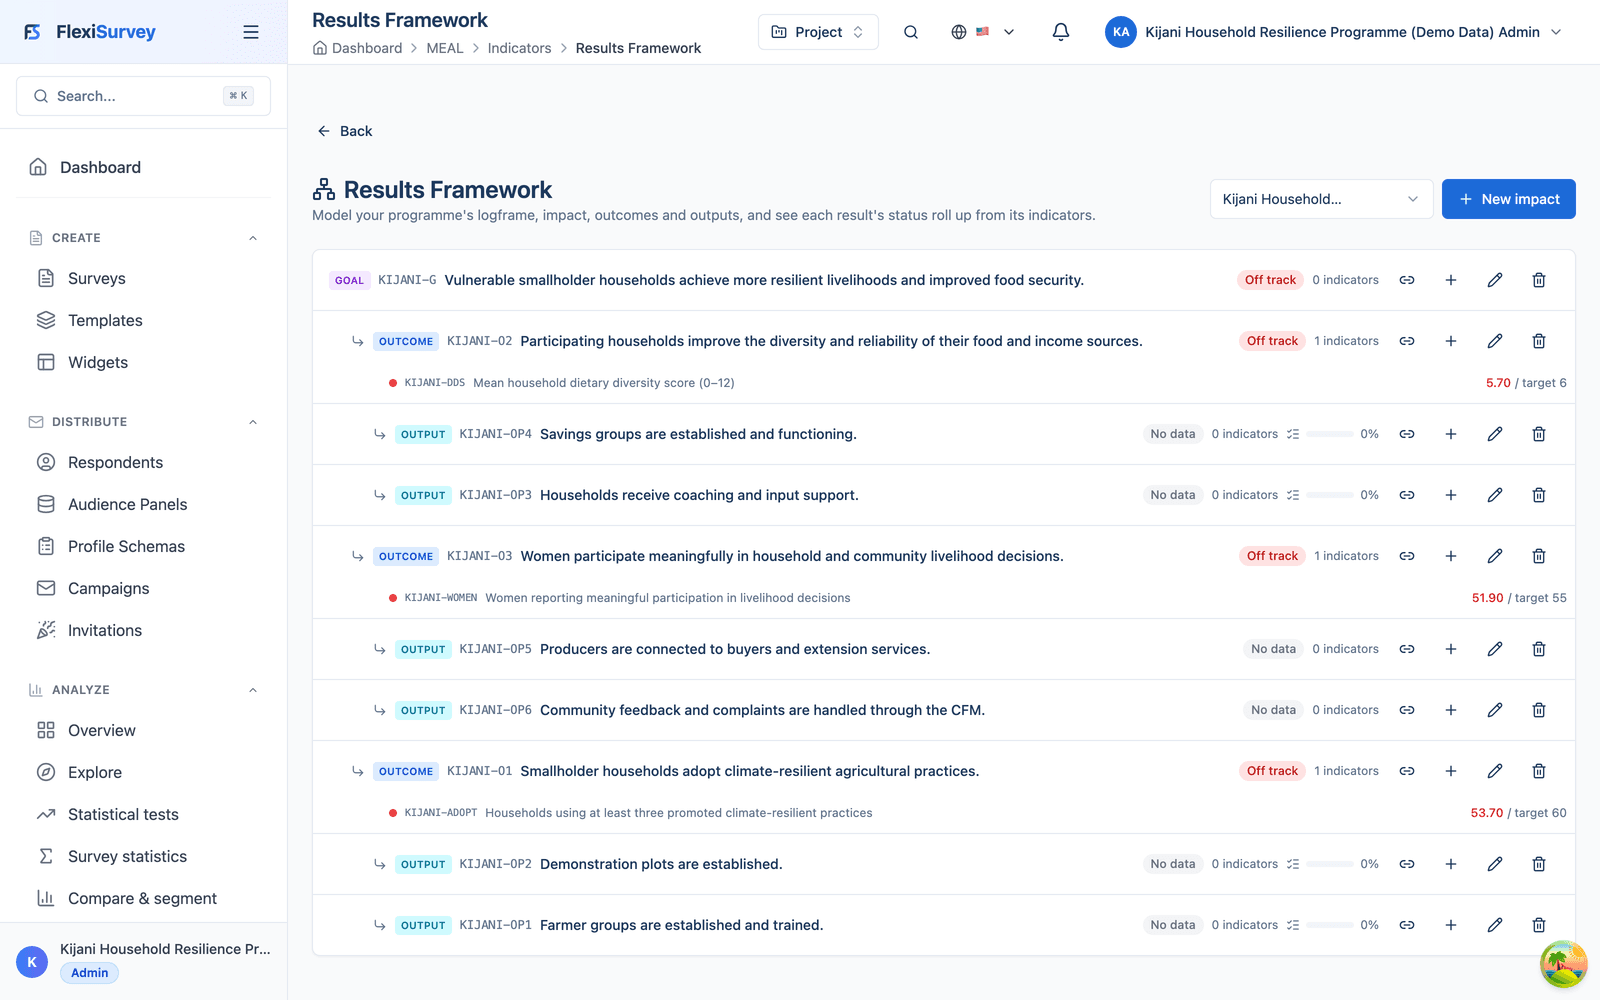
The team starts with an approved logframe, work plan, indicator table and reporting schedule. In FlexiSurvey these become a living programme structure: a goal-to-activities results framework, indicators attached to the result they measure, activities beneath the outputs they deliver, and named owners, delivery partners and reporting periods. The original approved framework is preserved even when later evidence requires the programme to adapt.
- Goal, outcomes, outputs and activities in one traceable tree
- Indicators attached to the node they measure; activities beneath their output
- Owners, delivery partners, milestones and donor-reporting periods from day one
2. Collect the baseline in the field
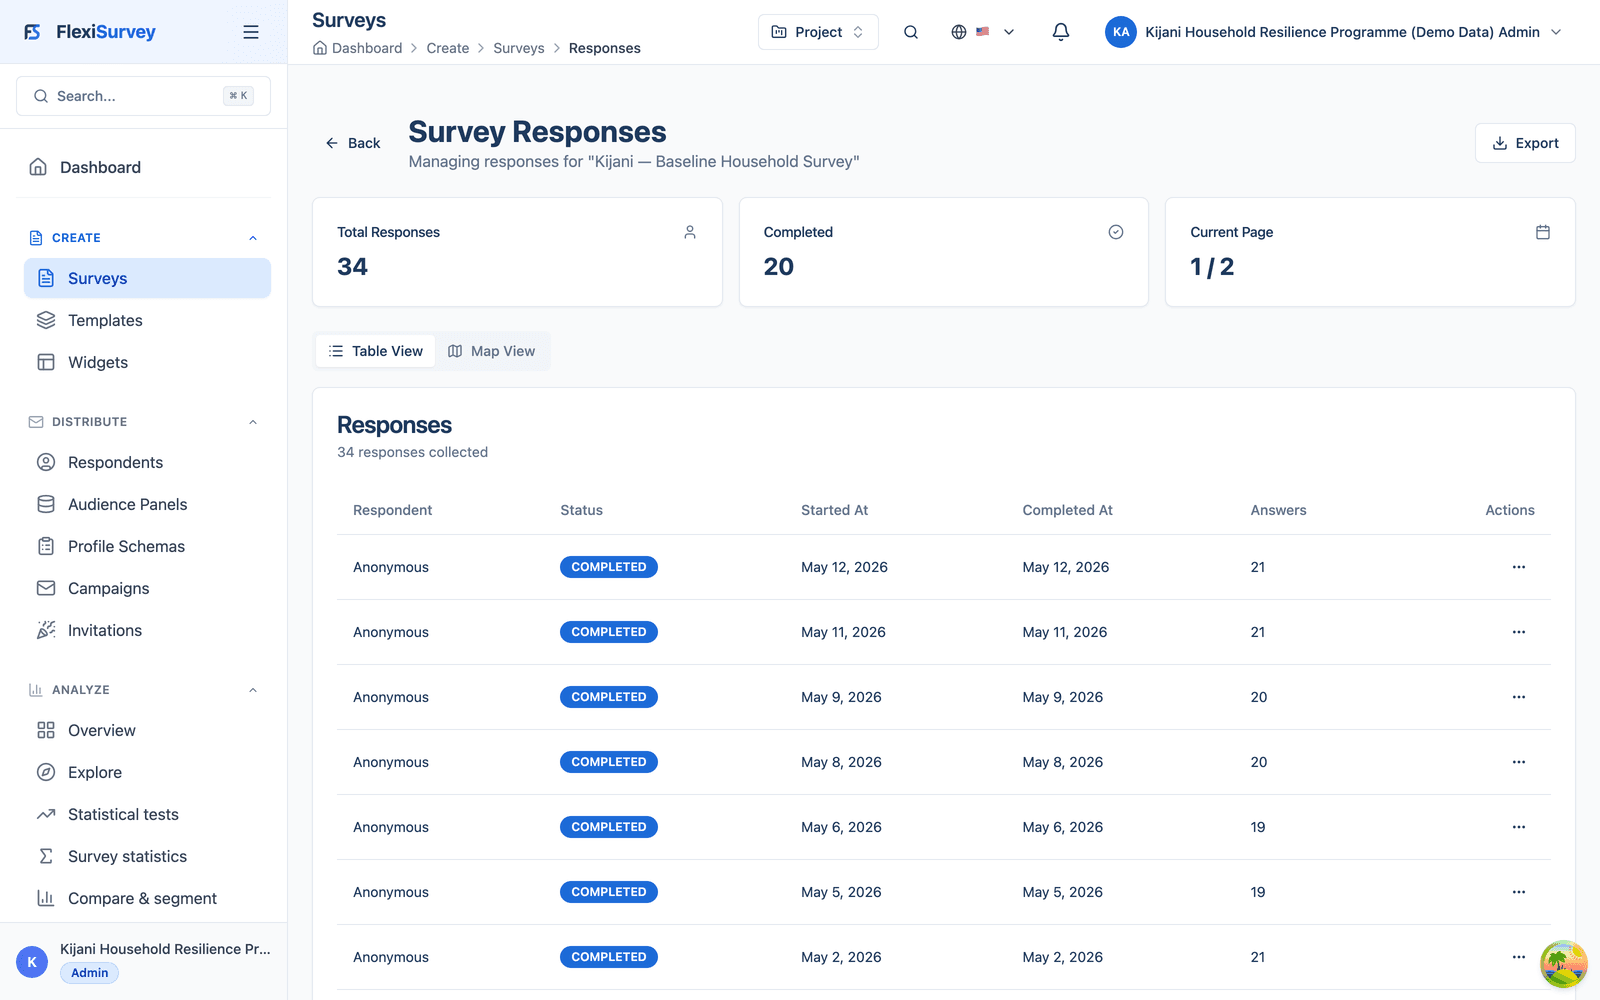
Before full implementation, the programme runs a baseline across the three districts, collected offline with multilingual instruments, GPS and consent, alongside focus groups and key-informant interviews. Each sampled household carries a longitudinal identifier so it can be recontacted at endline, and every completed interview lands in one place, a reviewable responses table with a map view, where supervisors track completion against target.
- Offline collection with GPS and consent, synced when connectivity returns
- Longitudinal household identifiers for recontact at endline
- Every response in one reviewable table, with a map view of where it came from
3. Catch a data-quality problem before it reaches the indicators
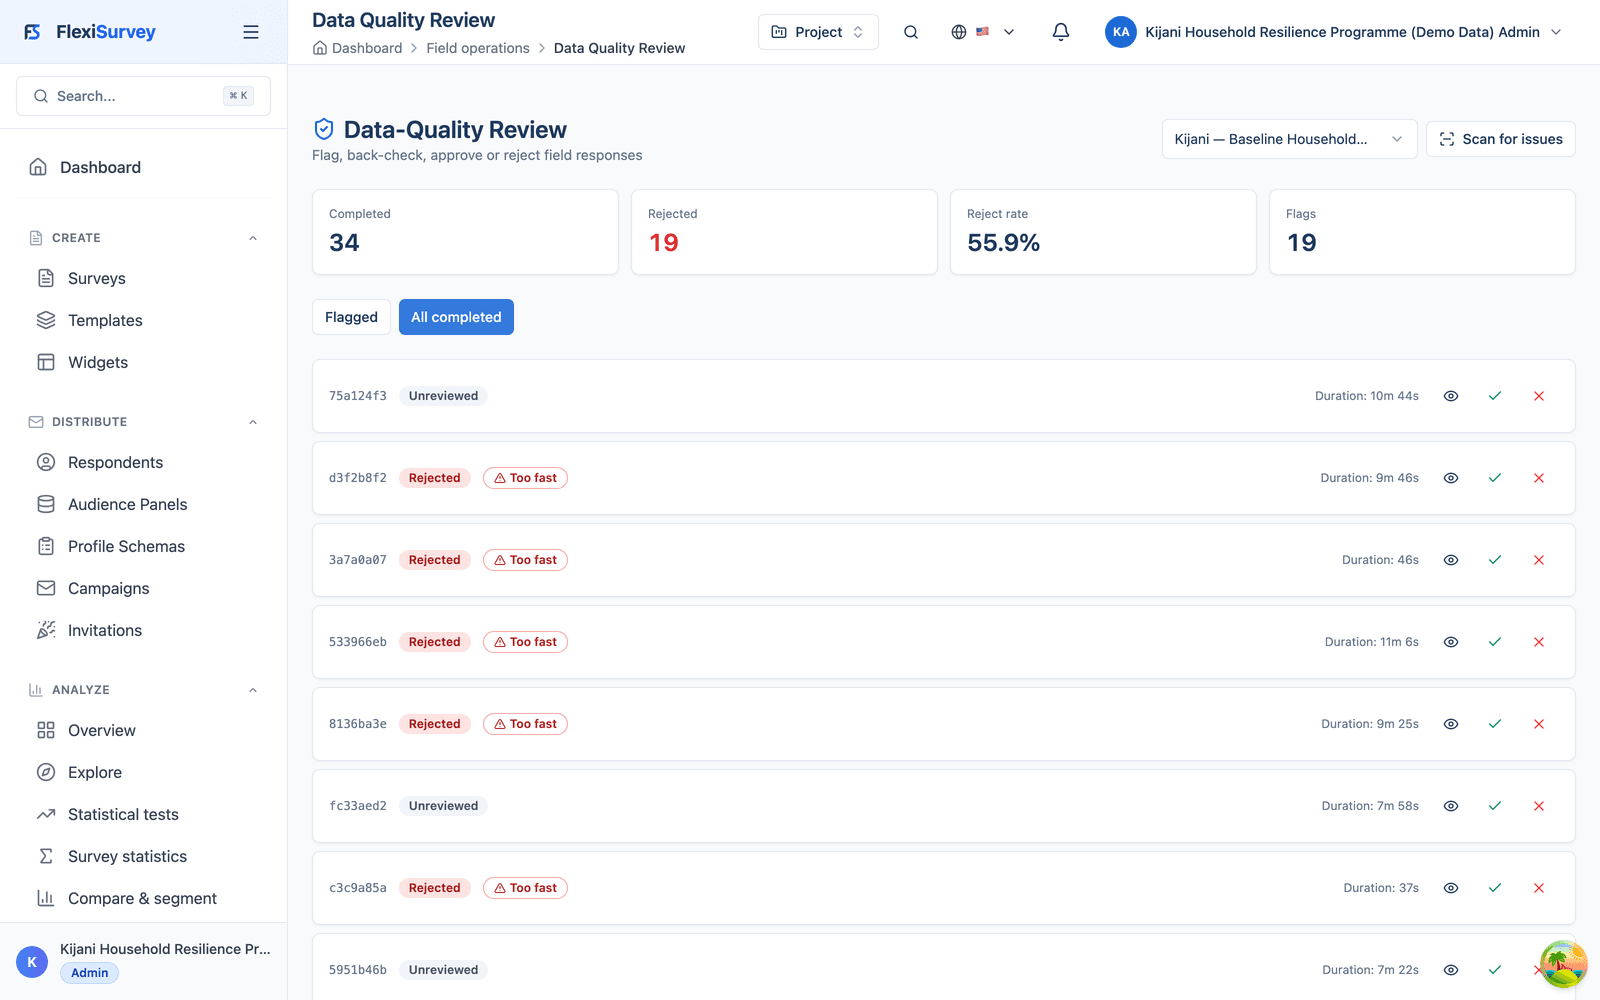
In the first days of fieldwork, one enumerator's submissions show interview times under half the expected duration and repeated dietary answer patterns. The supervisor flags the responses, pauses that enumerator's remaining assignments, runs back-check interviews, rejects the ones that fail and reassigns the affected households, every step recorded in the quality log. A live reject rate keeps the picture honest, and only approved responses feed the baseline indicators, so a bad batch never quietly becomes a headline figure.
- Quality flags surface short interviews, duplicate patterns and GPS variance
- Back-check, reject and reassign, with the action recorded rather than just described
- Only approved responses compute into indicators; rejected data is excluded
4. Define each indicator once, and compute it from approved data
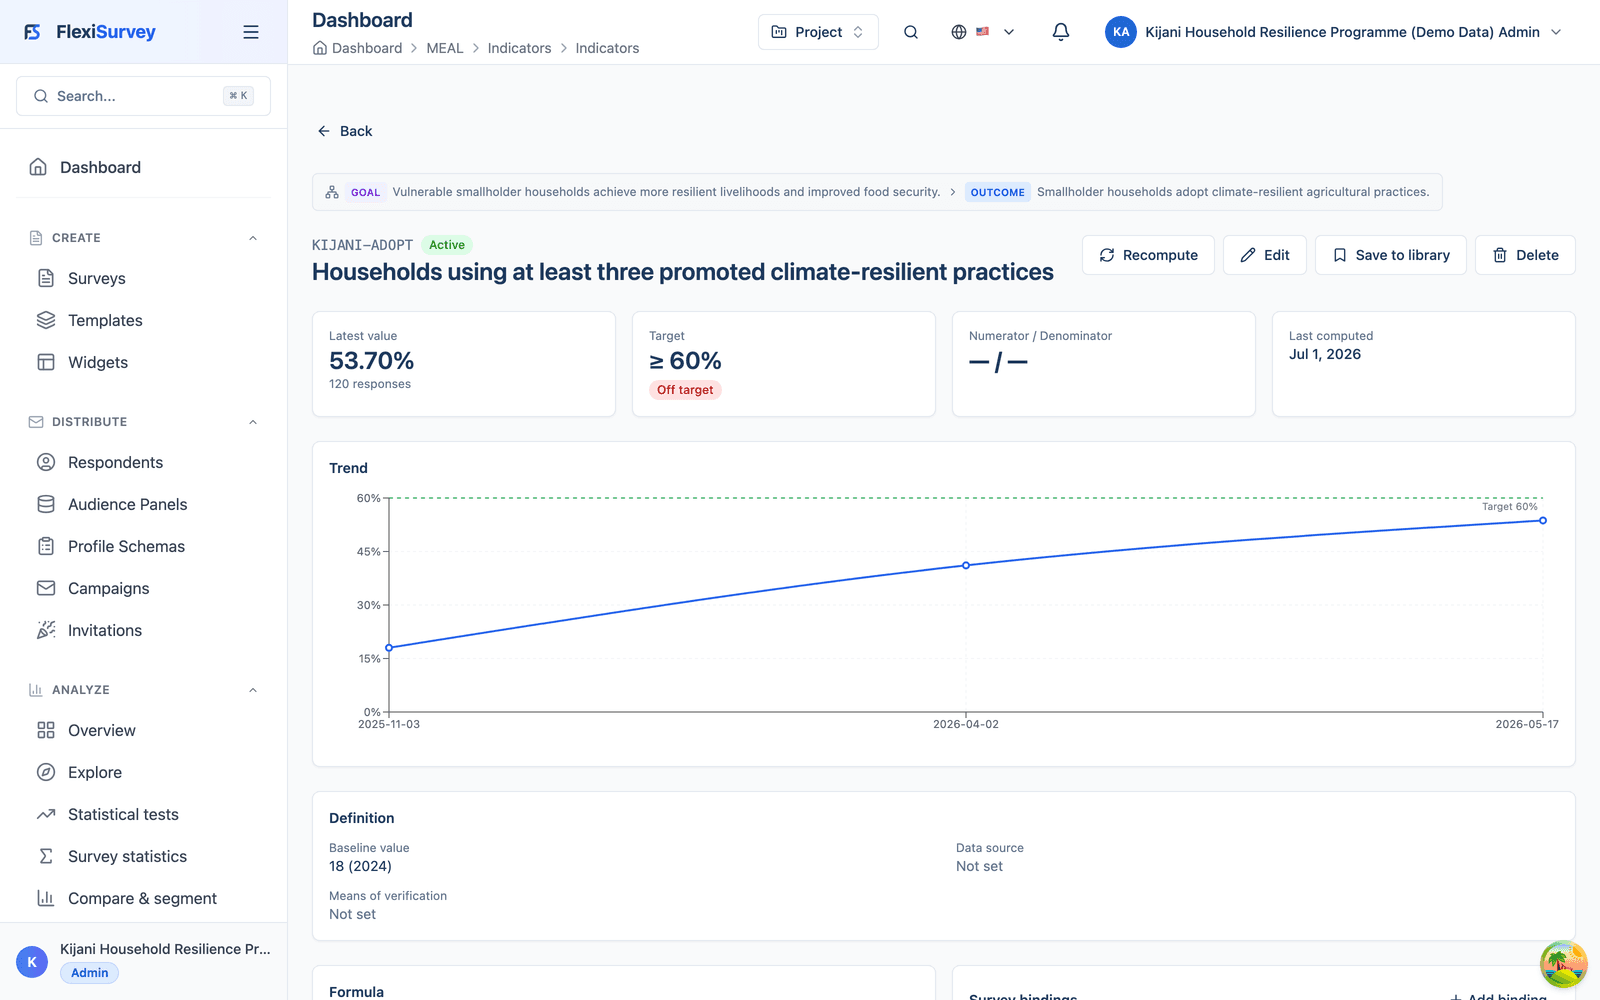
Each indicator carries its definition in one place: baseline value, target, the formula that computes it, the data source and its disaggregation rules. Values calculate from approved survey responses rather than being re-keyed by hand, and a manager can move from the indicator to its formula, from the formula to the survey questions, and from the value to the approved responses behind it. Where a figure comes from an external source, a manual value stays possible provided the reason, source and evidence are preserved.
- Baseline, target, formula, source and disaggregation on every indicator
- Computed from approved responses: trace value → formula → question → response
- Manual values allowed for external sources, with reason and evidence kept
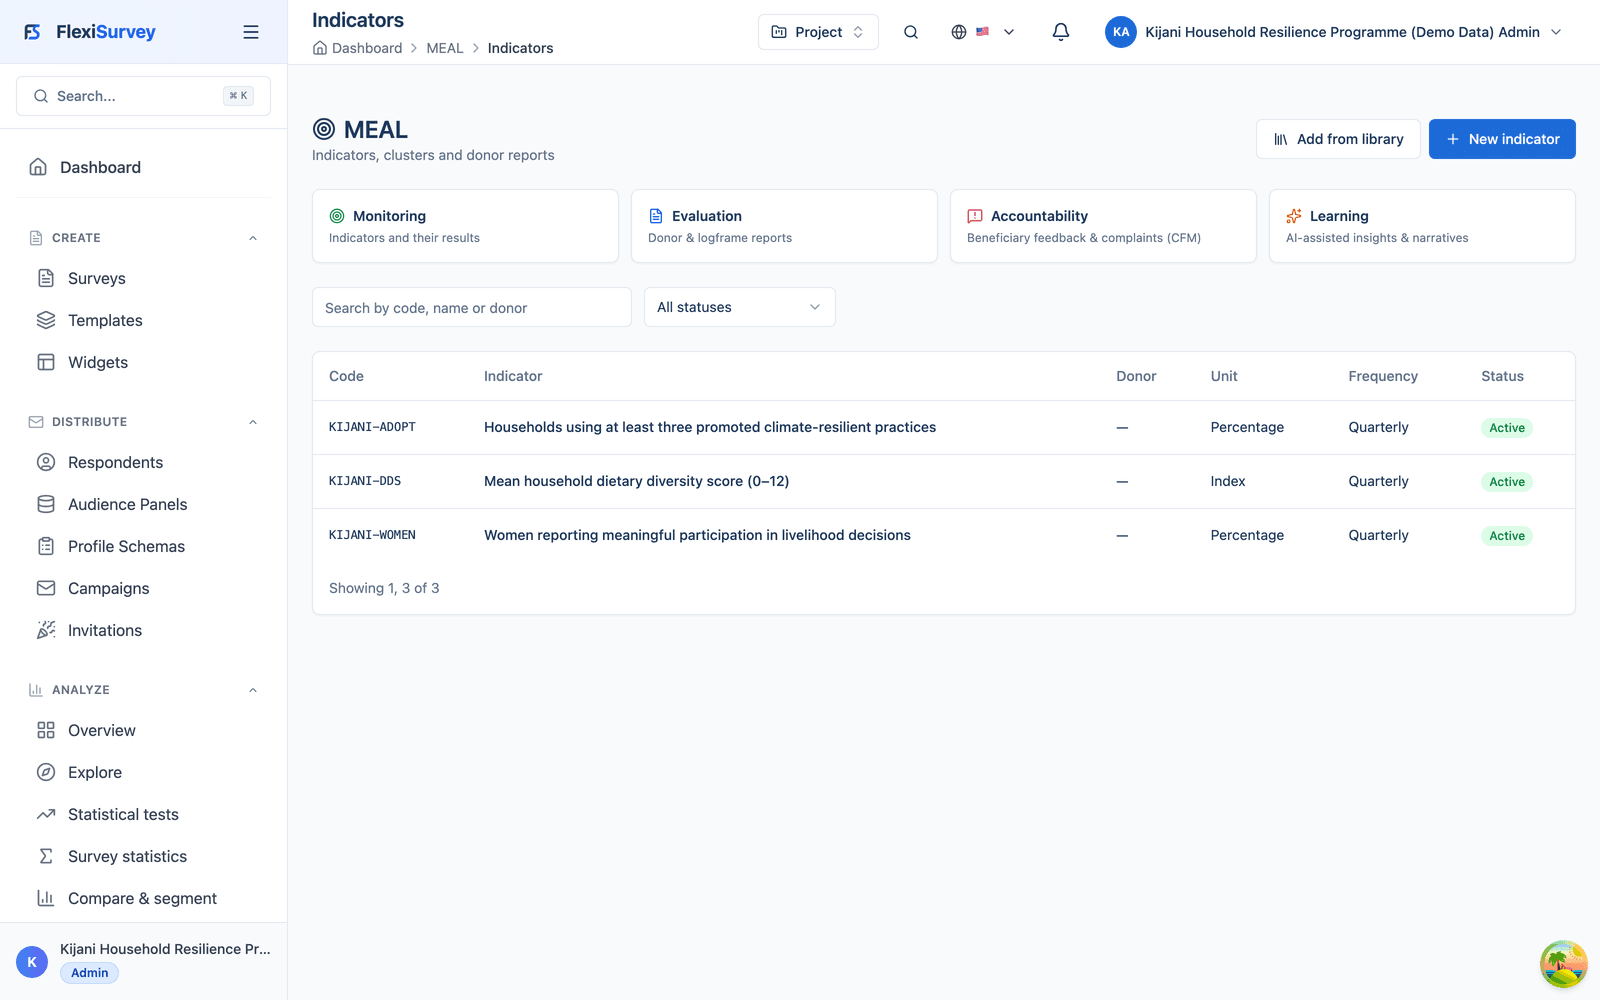
5. Let the baseline change the plan, not sit in a report
The baseline shows that only 18% of households use three or more promoted practices, that women have less access to extension advice, that shared phone numbers cannot safely identify a household, and that the planned training calendar clashes with peak farm labour. The steering committee approves five changes (a new household matching field, village-level sessions, rescheduled training, more female lead farmers and more demonstration plots), each recorded against the evidence that prompted it, an owner, an approval date, the activities and indicators affected, and completion evidence.
- Each decision links to the evidence, an owner, an approval date and a due date
- The activities and indicators affected are recorded, not left implicit
- The baseline becomes the programme's first management tool
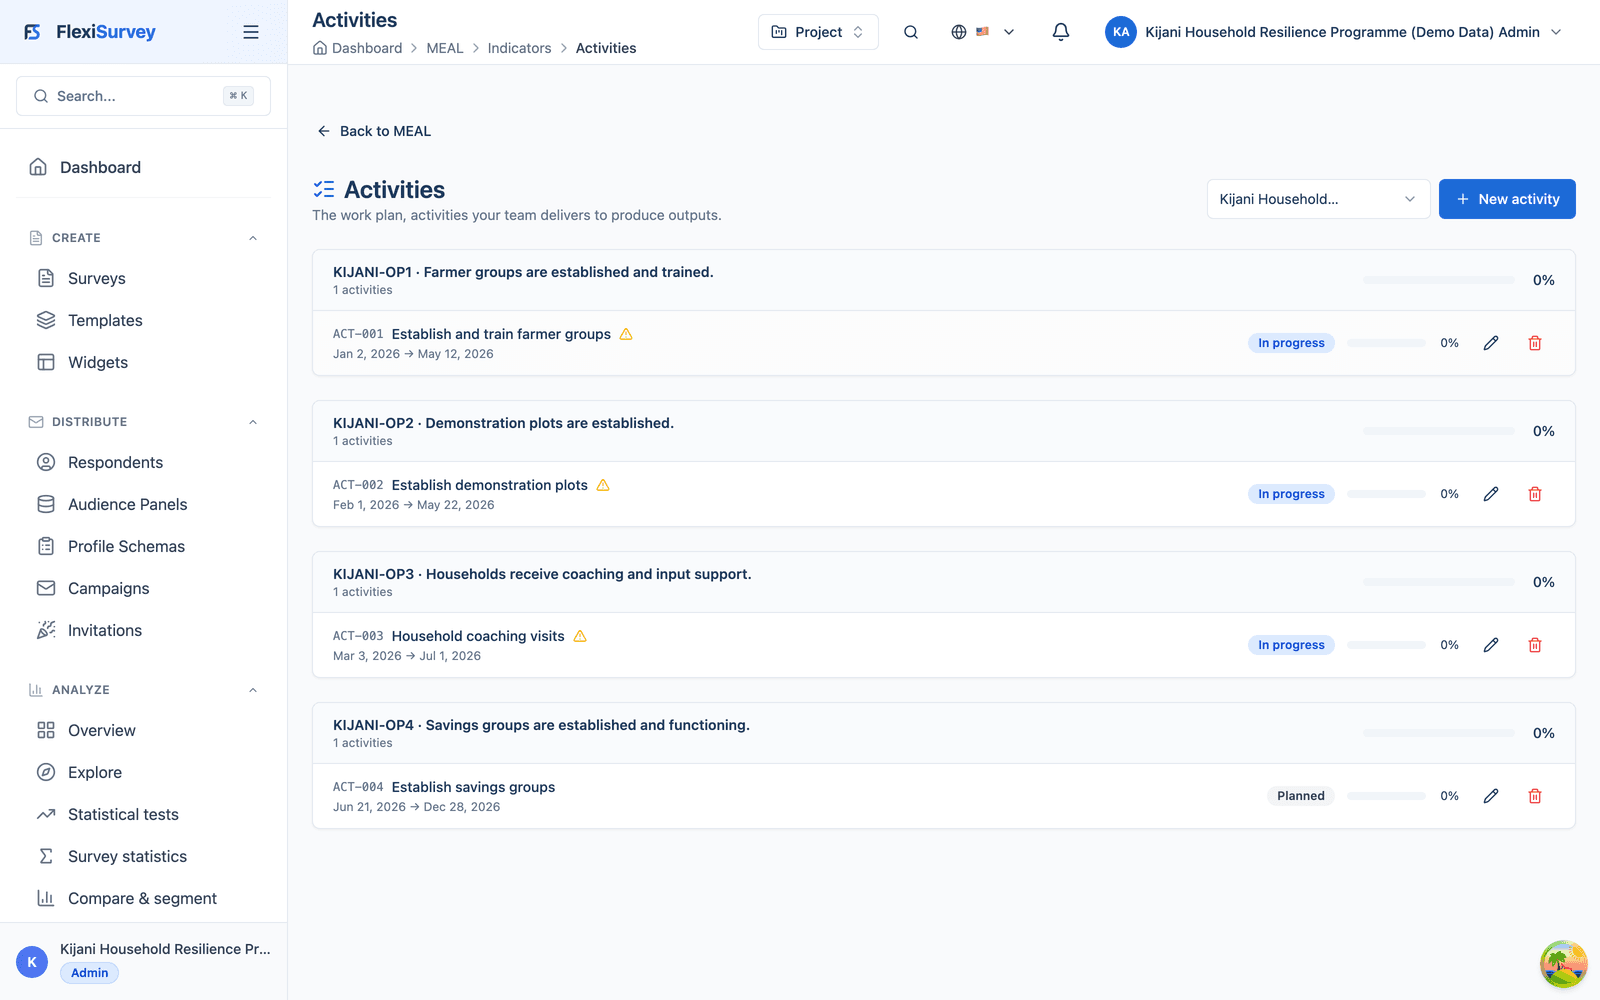
6. Enrol participants and deliver against the work plan
Approved households enter the registry and are assigned to farmer groups, locations and support pathways. Training attendance, demonstration-plot establishment, input distributions, coaching visits, savings-group participation and market linkages are each logged with location, implementing partner, responsible officer, participant count and disaggregation. Progress shows against both the programme target and each partner's assignment, and a completed activity is deliberately not treated as an achieved outcome.
- Participant registry with farmer group, pathway, consent and delivery history
- Every activity log carries partner, officer, count, disaggregation and evidence
- Activity completion, output delivery and outcome change kept distinct
7. Tell the difference between delivery and change
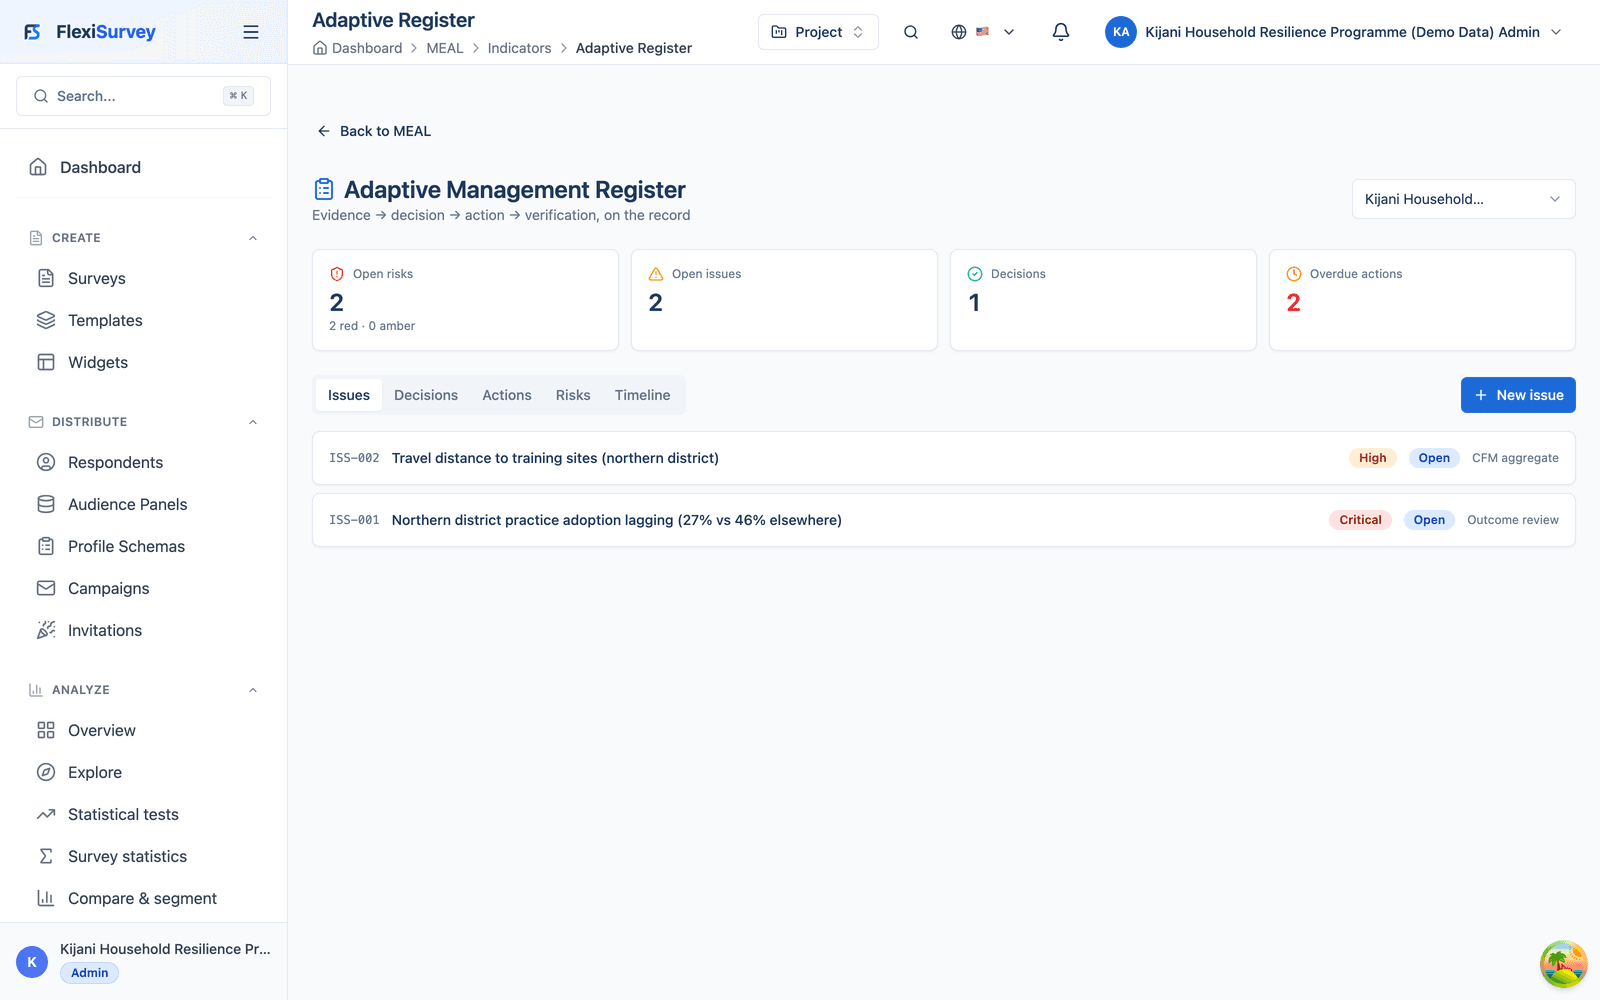
By month nine, delivery looks strong: 78% of households trained, 86% of demonstration plots established, 92% of input packages delivered. But outcome monitoring shows adoption in the northern district at only 27%, against more than 45% elsewhere. Reviewing household surveys, field observations, focus groups, plot records, partner performance and complaints reveals training delivered too early for the planting calendar, two plots without reliable water, and participants needing follow-up support, so the team opens corrective actions with owners and due dates.
- Outcome dashboards separate 'did the activity happen' from 'did adoption change'
- District and partner disaggregation surfaces an uneven programme, not an average
- Corrective actions carry owners and due dates until each is verified
8. Adapt at mid-term without erasing what you promised
At month 12 the review combines routine data with a 240-household survey, qualitative research, partner performance and CFM findings. It concludes the programme is progressing but uneven, and management reallocates coaching staff, extends savings-group support, adds female mentorship and increases oversight of the weaker partner. The mid-term snapshot is frozen before the revised work plan takes effect, so the programme can always show what was originally planned, what the evidence revealed and what management changed in response.
- Mid-term snapshot frozen before the revised plan takes effect
- Versioned work-plan changes preserve the original commitment and the reason
- A living framework stays editable without erasing history
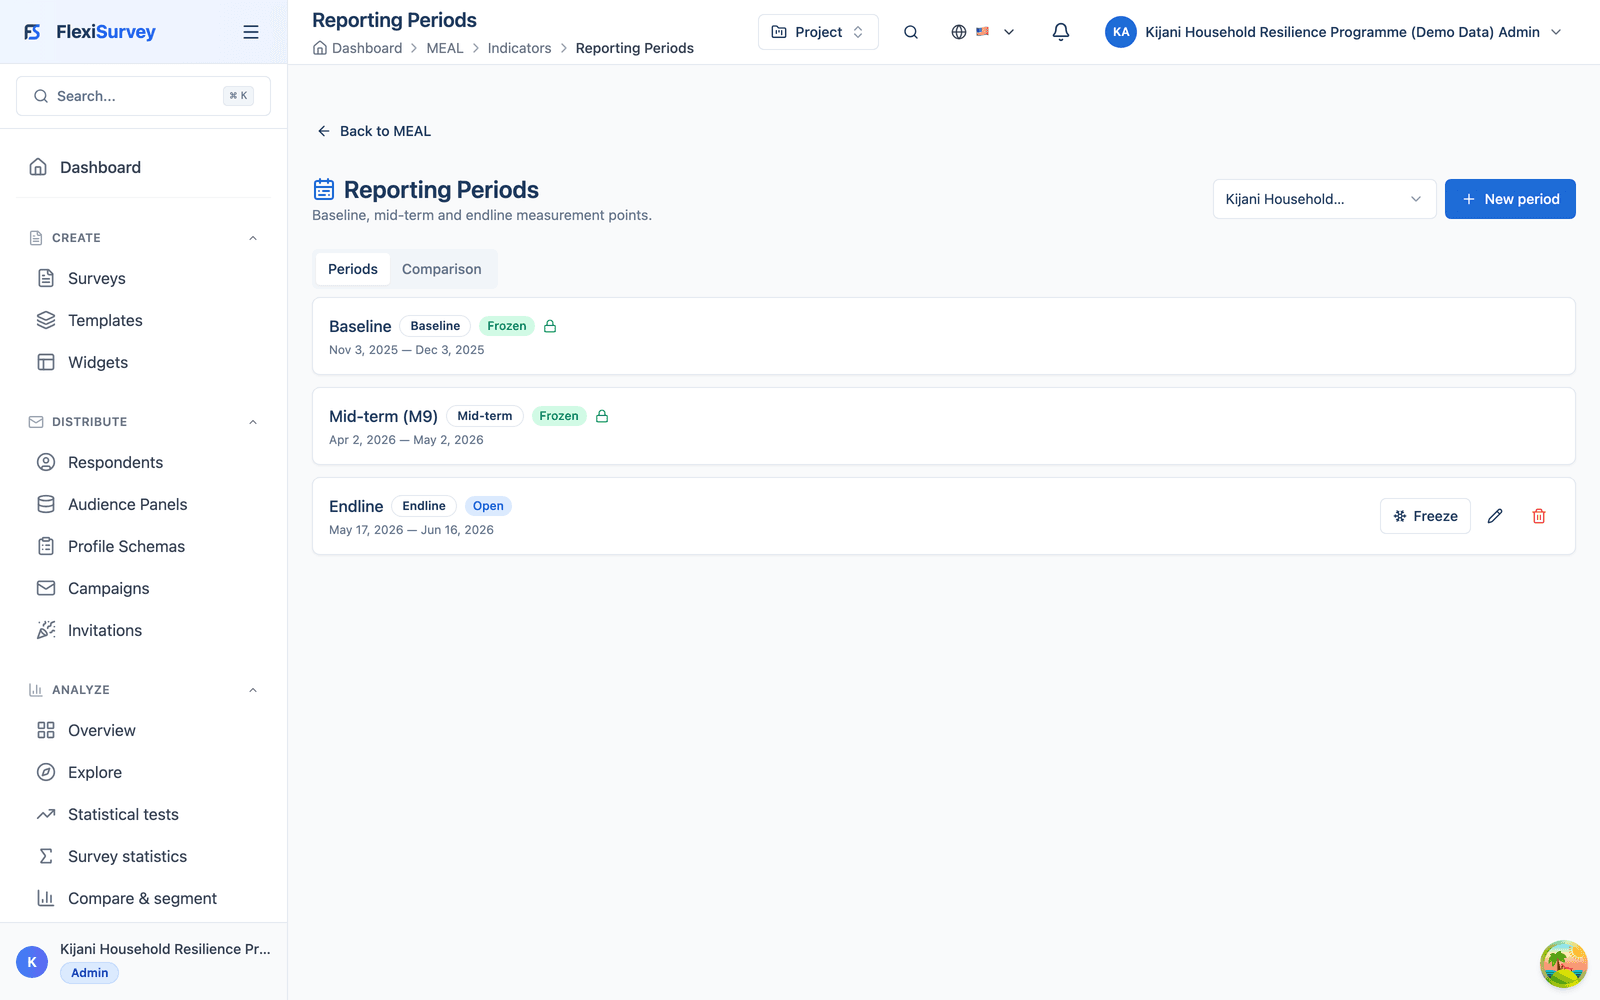
9. Measure the final position against the same yardstick
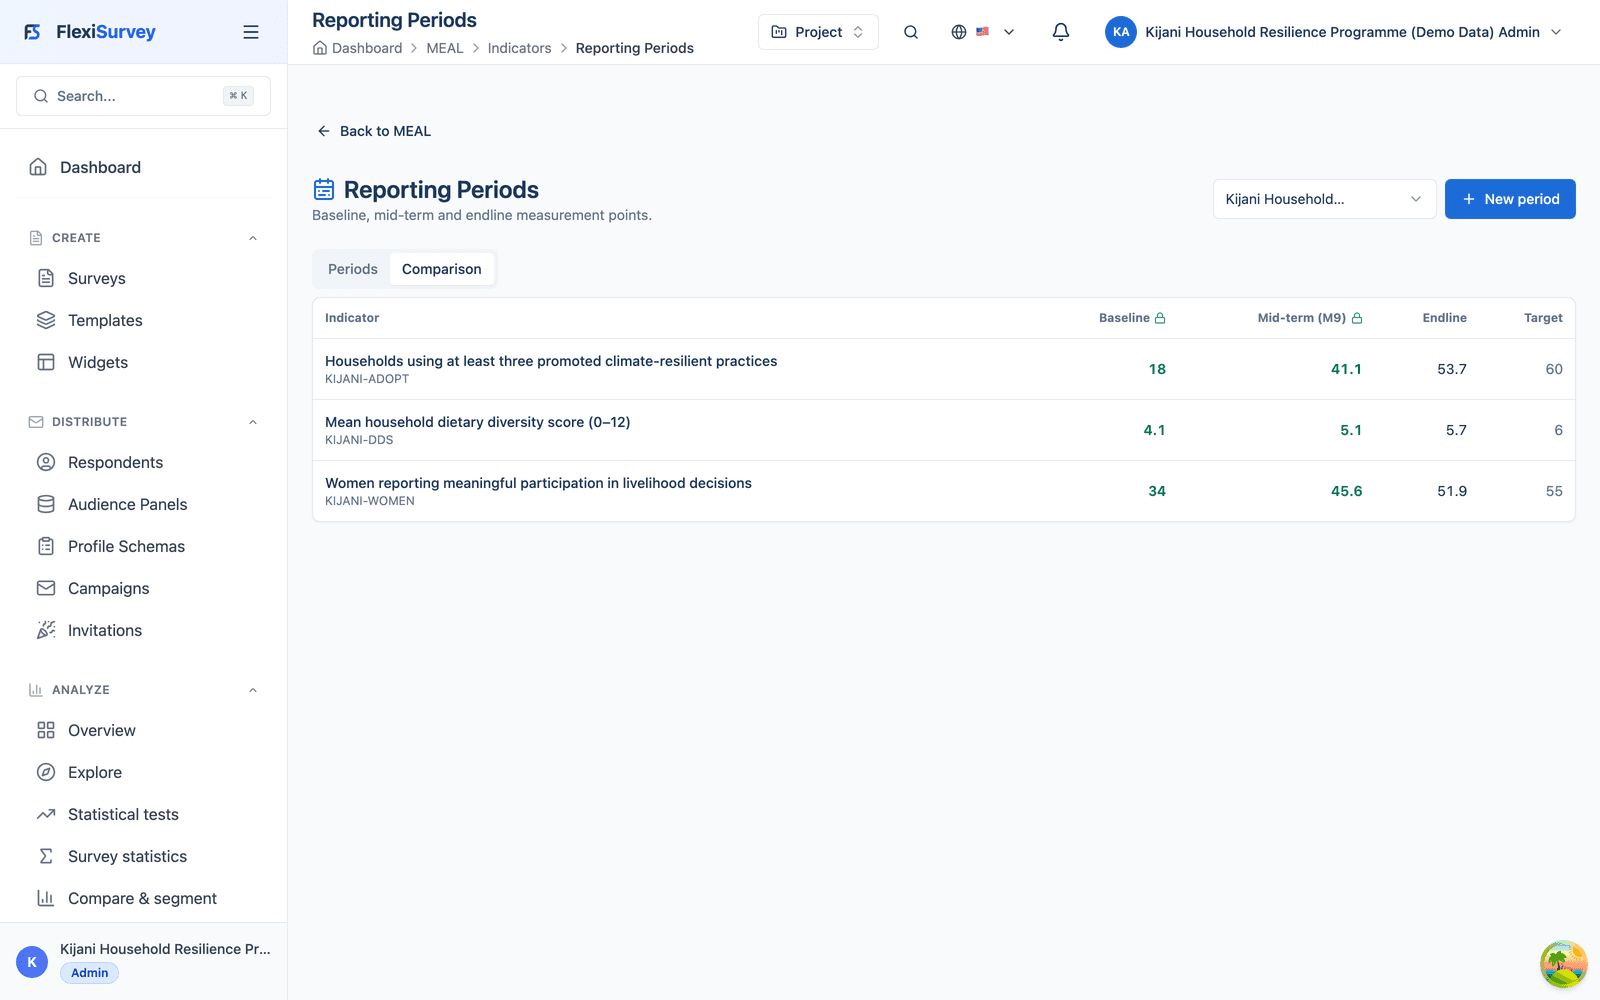
The endline returns to the same three districts, reuses the approved core outcome questions and recontacts the longitudinal household panel, documenting attrition and replacements. Every headline indicator moves strongly from its baseline (adoption of promoted practices from 18% to 53.7%, dietary diversity from 4.1 to 5.7, and women's participation from 34% to 51.9%), closing most of the gap to target while finishing just short of it. That is a realistic result, and the evaluation records the shortfall rather than rounding it up. The language stays about the programme's contribution, not a claim that it caused every observed change.
- Same districts, same core indicators, comparable definitions preserved
- Baseline, mid-term, endline and target side by side: real gains, honestly short of target
- Contribution language, not overstated causal claims
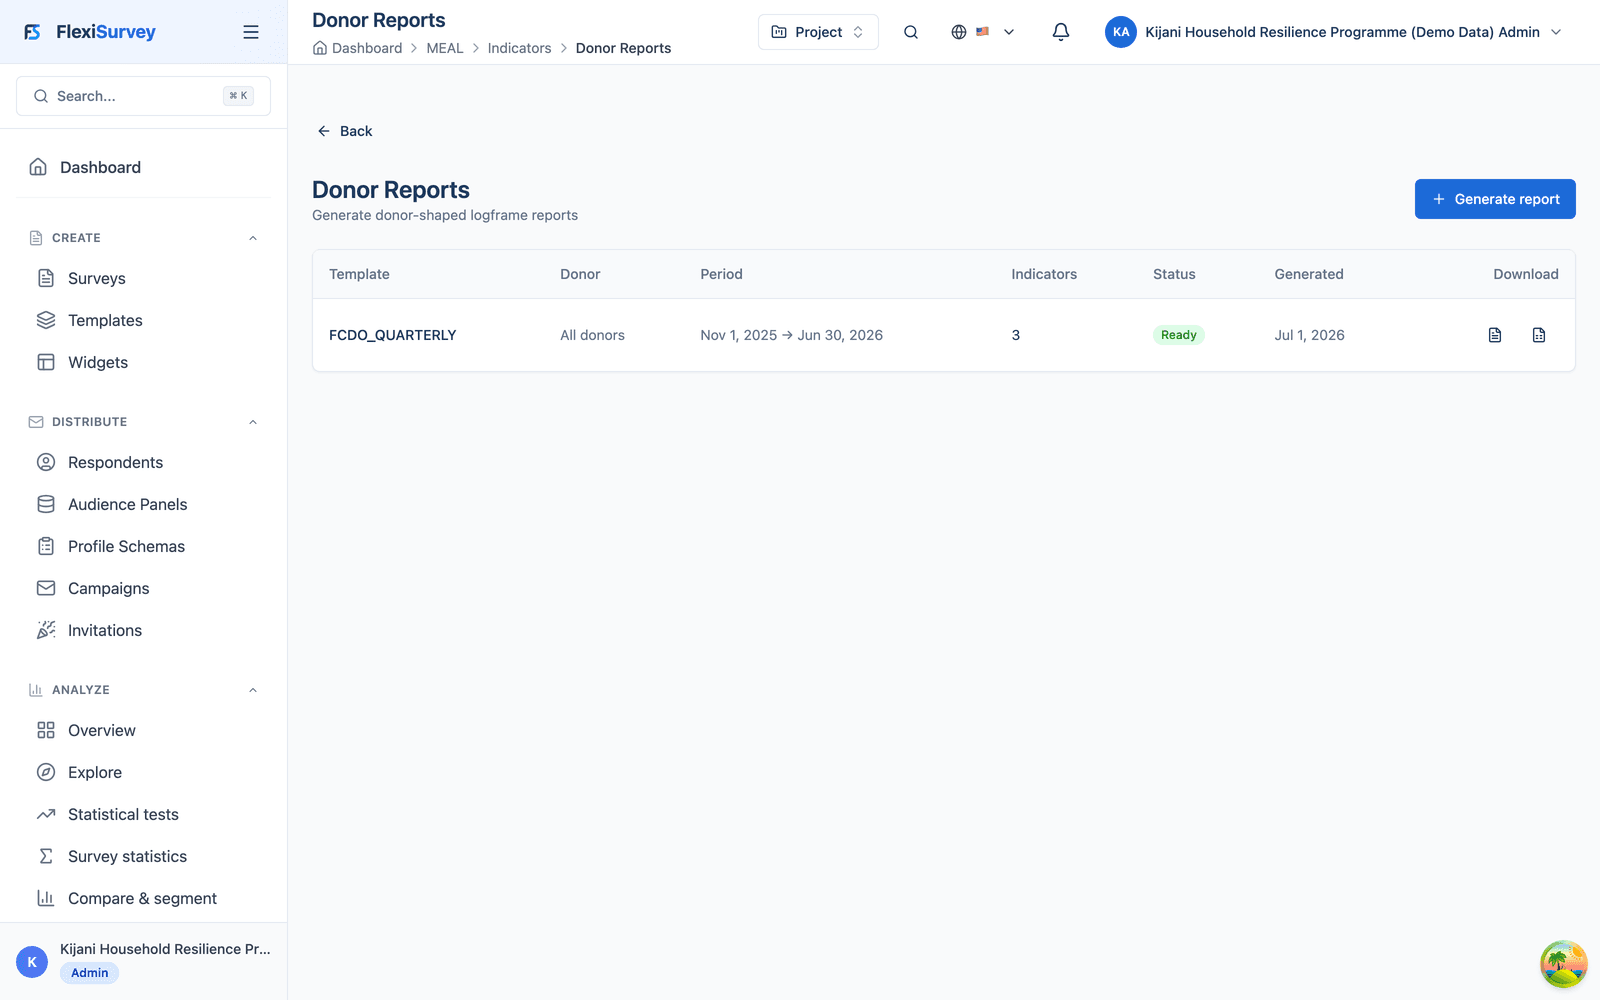
10. Produce the final donor report without rebuilding the evidence
The final reporting period freezes the approved endline figures, and FlexiSurvey generates a publication-ready PDF and matching Excel workbook: results-framework achievement, baseline–mid-term–endline comparisons, disaggregation, activity and output delivery, adaptations, accountability findings, risks and lessons learned. A later recomputation does not silently change the edition already submitted, and every published figure stays traceable to the approved indicator value and source records used at the time of reporting.
- Publication-ready PDF and matching Excel from the approved figures
- Frozen editions: a later recompute never rewrites what the donor received
- Every figure traceable back to its indicator and source responses
How it works
The typical flow from setup to output.
Bring your logframe
Bring your results framework, indicator table, work plan and reporting schedule. We map them to FlexiSurvey MEAL in the walkthrough: your programme, your rules.
Run one evidence chain
Baseline, monitoring and endline feed the same indicators; delivery, quality flags and decisions all attach to the programme, so nothing is re-keyed.
Report and adapt with confidence
Freeze approved figures into a donor edition, adapt the plan without erasing history, and trace any published number back to its source.
Plays well with
Adjacent capabilities and solution pages you might want to read next.
The full MEAL feature: results frameworks, indicator formulas, work plans, disaggregation, reporting periods and donor reporting.
The accountability side of MEAL: one beneficiary complaint through the Complaints and Feedback Mechanism, intake to verified closure.
Enumerator assignments, offline worklists, GPS and consent: the fieldwork behind the baseline and endline.
See the Kijani programme in the live product
Book a walkthrough and we'll open this programme with you (the results framework, the baseline data-quality intervention, the mid-term adaptation, the endline comparison and the frozen donor report, end to end), then map it to your logframe, indicators and reporting periods.
Talk to our team