Monitoring, Evaluation, Accountability and Learning
Organisation planConnect programme results to the data that measures them
Build a living results framework, define indicators and targets, calculate values from survey responses, track disaggregation, and prepare reporting from one traceable source.
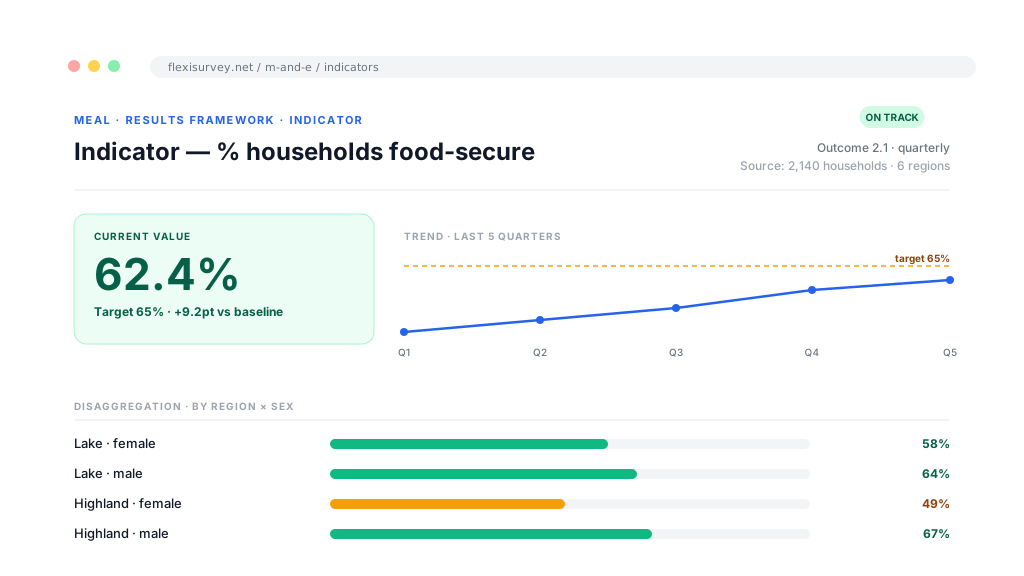
Donor-funded measurement usually lives across disconnected tools. The survey runs in one place, the indicators sit in a spreadsheet, the logframe is a document, and someone rebuilds the donor report by hand every quarter. Numbers drift between systems, each disaggregation is re-derived from scratch, and no one can trace a reported figure back to the responses behind it.
FlexiSurvey keeps the whole chain together. The results framework is a living structure, indicators attach to the nodes they measure and compute through auditable formulas bound to your survey questions, disaggregation by location, sub-group and time happens on its own, and reporting renders from those same figures. MEAL is available on Organisation and Enterprise plans, with donor-report generation on Enterprise; the entitlement is shown once here rather than repeated through the page.
What you can do
6 pillars, each one expanded further down with bullets and a screenshot.
Results framework / ToC
Goal, Impact, Outcome, Output and Activity as a living tree, with indicators attached to nodes.
Indicators & formulas
Target, baseline, means of verification and an auditable formula, recomputed on a schedule and logged.
Work plan & delivery
Activities with owners, milestones and quantitative delivery targets, under the relevant outputs.
Donor reporting
Render a verified donor template for a reporting period and freeze the figures used in that edition.
Tamper-evident evidence trail
Every change to indicator evidence joins a cryptographic hash chain that can be independently verified.
Adaptive management register
Track risks, issues, decisions and actions against a programme, each with an approve-and-verify step.
Model the results chain
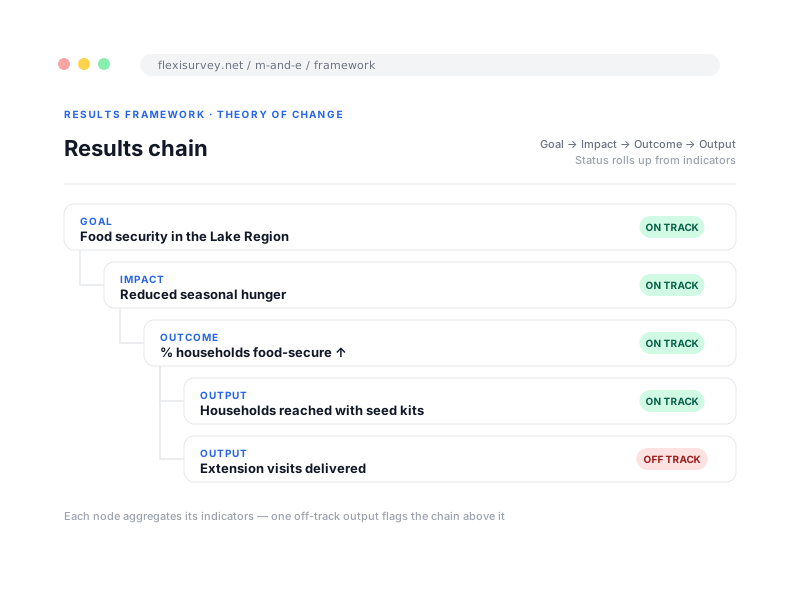
Represent Goal, Impact, Outcome, Output and Activity as a working hierarchy rather than a static file. Attach each indicator to the level it measures, let status roll up the tree so on-track and off-track are clear at every level, and record programme or SDG alignment where it is relevant.
- Model the full results chain as a living, editable hierarchy
- Attach indicators to the framework node they measure, and let results roll up
- Tag nodes and indicators with the SDG goals and targets they support
- Keep a work plan of activities under each output, so delivery sits beside measurement
Define indicators with reporting context
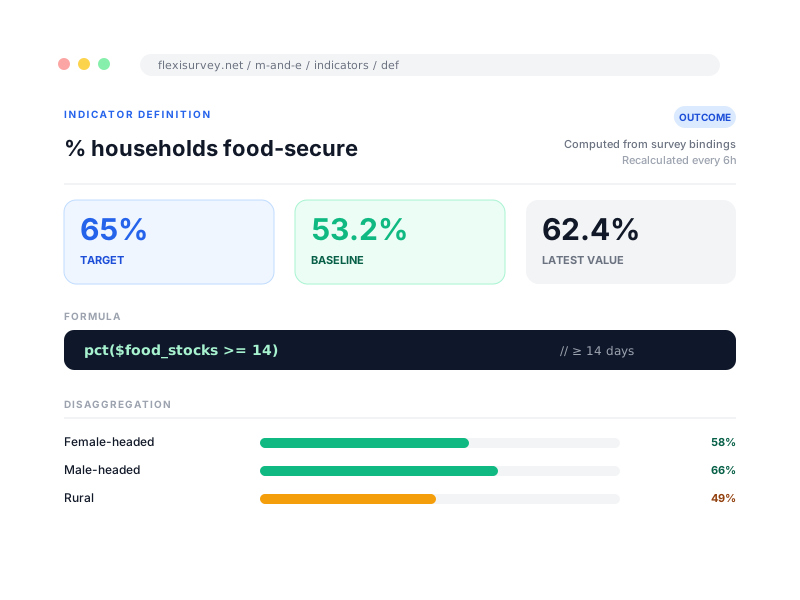
For each indicator, keep the definition, target, baseline, data source, means of verification, calculation and disaggregation rules together, the attributes that make a number reportable. Values compute through an auditable formula bound to your survey questions and refresh on a schedule from completed responses; every recomputation and manual override is recorded with a reason.
- Organisation-wide and location-level targets
- Scheduled computation from completed responses
- Manual overrides with reason and history
- Start from a 57-indicator library across seven sector packs, or write your own
Track delivery beside results
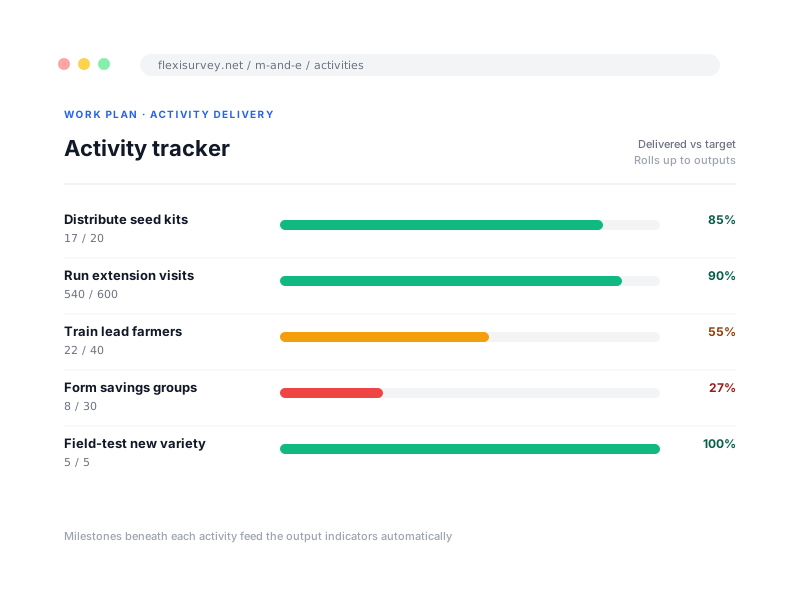
Place activities, owners, milestones and quantitative delivery targets under the relevant outputs, so teams can distinguish delivery progress from outcome measurement. An activity can carry a numeric target against which field teams log delivery as it happens, and an activity-monitoring indicator measures that delivery the same way a survey indicator measures an outcome.
- Plan activities under the output they deliver, with owners, schedules and milestones
- Give an activity a numeric target and log delivery incrementally; percent complete is calculated for you
- Use activity-monitoring indicators to aggregate delivered totals across a node
- Stand up a full programme from one of nine ready-made blueprints
Generate controlled reporting outputs
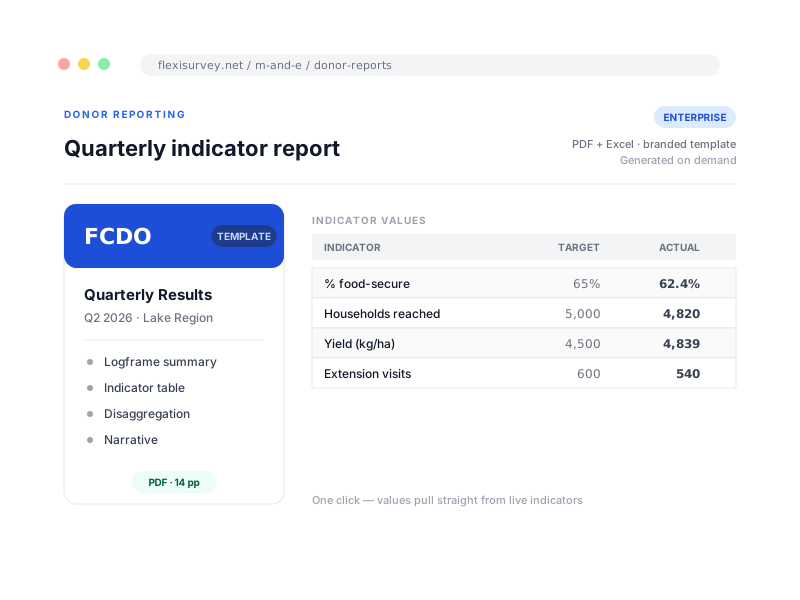
Create a report from a defined reporting period and freeze the values used in that edition, so a re-download returns the exact numbers the donor first received. Choose a verified template, FCDO, FAO, ECHO, UN-OCHA or a generic logframe, and FlexiSurvey produces a publication-ready PDF and a matching Excel workbook from the live figures, scoped to a single donor across a programme where needed.
- Five report templates render from the live figures, not a re-keyed copy
- Each report arrives as a publication-ready PDF and a matching Excel workbook
- Freeze the values used in a reporting period so editions are reproducible
- Scope a report to one donor across a whole programme
Evidence a verifier can independently check
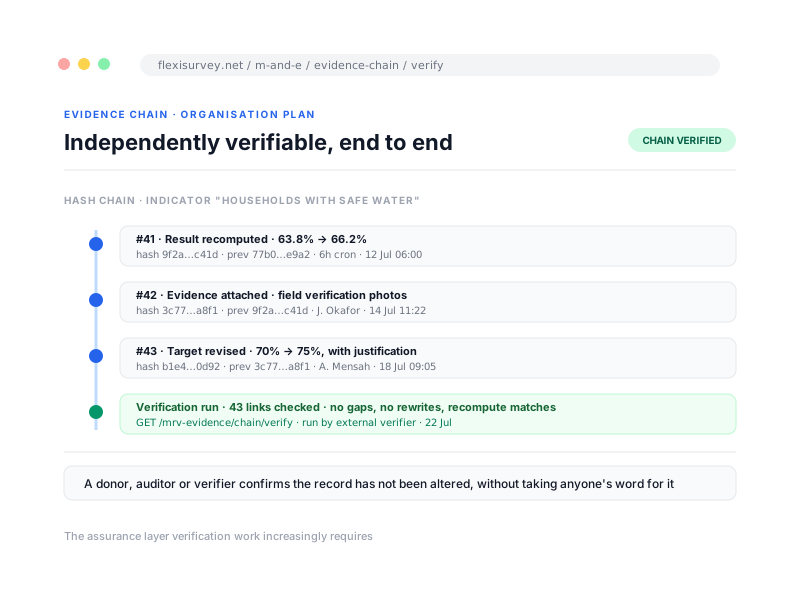
Every change to indicator evidence is written into a cryptographic hash chain that can be independently verified, so a donor, auditor or verifier can confirm the record has not been altered after the fact. It is the assurance layer that carbon, climate and impact-verification work increasingly requires. Available on Organisation and above.
- Every evidence change joins a hash chain
- Verification is independent, not taken on trust
- Tampering shows up precisely, not vaguely
- The assurance layer verification work requires
Course corrections, recorded and accountable
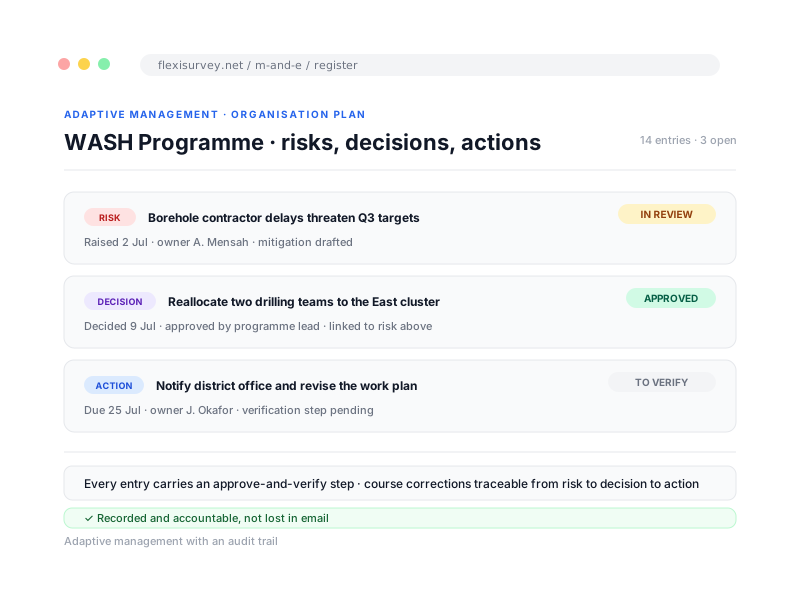
Track risks, issues, decisions and actions against a programme with an approve-and-verify step on each, so course corrections are recorded and accountable rather than lost in email. Available on Organisation and above.
- Risks, issues, decisions and actions in one register
- An approve-and-verify step on each entry
- Course corrections traceable to a decision
- Available on Organisation and above
How it works
The typical flow from setup to output.
Build the framework
Model the results chain from Goal through to Output, or start from a blueprint, and tag the SDG contributions.
Define indicators
Set targets, baseline and means of verification, then bind a formula to the survey questions that feed each indicator.
Bind data and compute
Responses flow in and indicator values recompute on a schedule, disaggregated by location, sub-group and time.
Publish a reporting snapshot
Render an FCDO, FAO, ECHO, OCHA or logframe report as PDF and Excel from the frozen figures, scoped to the funder.
Plays well with
Adjacent capabilities and solution pages you might want to read next.
The full programme view, from offline collection through MEAL, accountability and donor reporting.
Collect the responses your indicators read, online and offline, on native mobile apps.
Close the loop with the people you serve, the accountability that completes MEAL.
Map an existing logframe into FlexiSurvey
Bring a logframe or Theory of Change and we will show you how it becomes a living framework, measured from your own responses.
Talk to our team