Survey statistics
Organisation planEstimate populations using the sample design that produced the data
Calculate weighted estimates and survey-weighted models while accounting for strata and clusters. Every result carries design-aware uncertainty and documented validation against R's `survey` package to 1e-6.
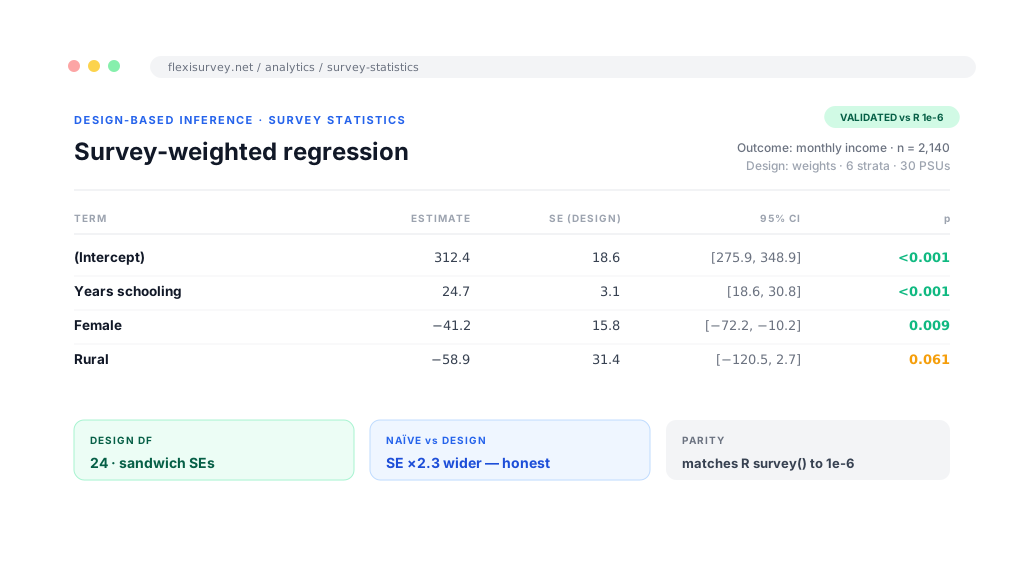
Most surveys that inform a programme or a published evaluation are not simple random samples. They are weighted to correct for unequal selection and post-stratification, drawn in strata, and clustered by household, village or school. The moment a design looks like that, the everyday statistics in a spreadsheet, or in a stats package fed a flat export, quietly understate your uncertainty and hand you confident answers that will not survive review.
FlexiSurvey's inference engine runs the design-based statistics that get the variance right: weighted means and proportions, survey-weighted linear and logistic regression with design-based (sandwich) standard errors, an adjusted-Wald chi-square test of independence, and a survey-weighted two-group t-test. There is one estimation path in which a simple random sample is just the degenerate case, never a separate, optimistic shortcut.
Every estimator is validated against R's `survey` package to a 1e-6 tolerance on every build, so the figures are the ones a methodologist would reproduce by hand. Computation runs on FlexiSurvey's own secure infrastructure and is never sent to a third-party statistics service, with a sovereign on-premise deployment available for Enterprise programmes that need it. Design-based inference is available on Organisation and Enterprise plans.
What you can do
4 pillars, each one expanded further down with bullets and a screenshot.
Design-correct variance
Tag the weight, stratum and cluster once; FlexiSurvey applies that design to every estimator.
The core estimator set
Weighted means, survey-weighted regression, adjusted χ² and t-test, each with design-based SEs and CIs.
Validated to 1e-6
Every estimator matched to R `survey` reference fixtures on every build; the methods note is available on request.
Computed in-platform
Estimates run on FlexiSurvey's own infrastructure, never sent to a third-party statistics service.
Represent the sample design once
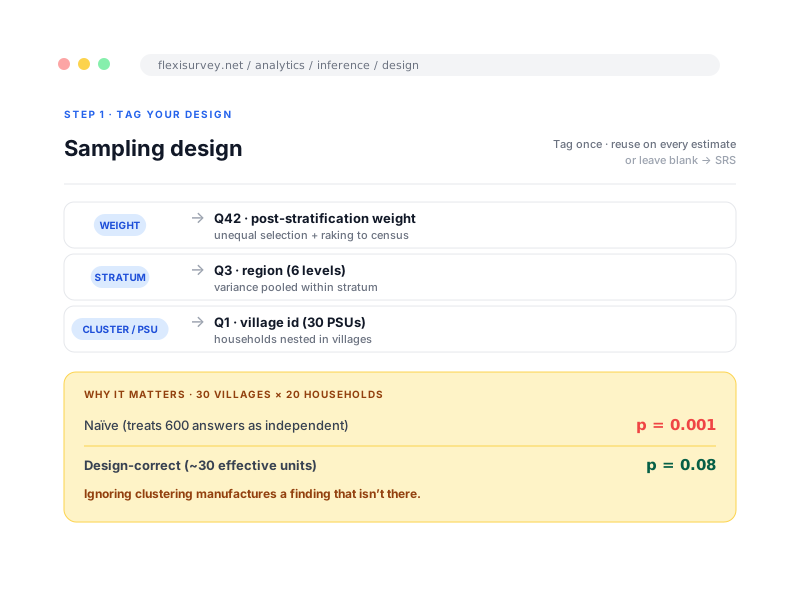
Identify the weight, stratum and primary sampling unit variables associated with a survey or dataset, and FlexiSurvey applies that design consistently across supported estimators. A worked example: 30 villages by 20 households. A naive test treats it as 600 independent answers and reports p = 0.001; design-correct, about 30 effective units, gives p = 0.08. Ignoring clustering manufactures findings. When a design genuinely cannot support an estimate, you get a clear, actionable message rather than a fake-precise number.
- Handles sampling weights, strata and clusters / PSUs, not just simple random samples
- One estimation path, with a simple random sample as the degenerate case
- The same design applied consistently to every supported estimator
- A clear message when a design cannot support an estimate, not a false precision
Run supported estimators with transparent output
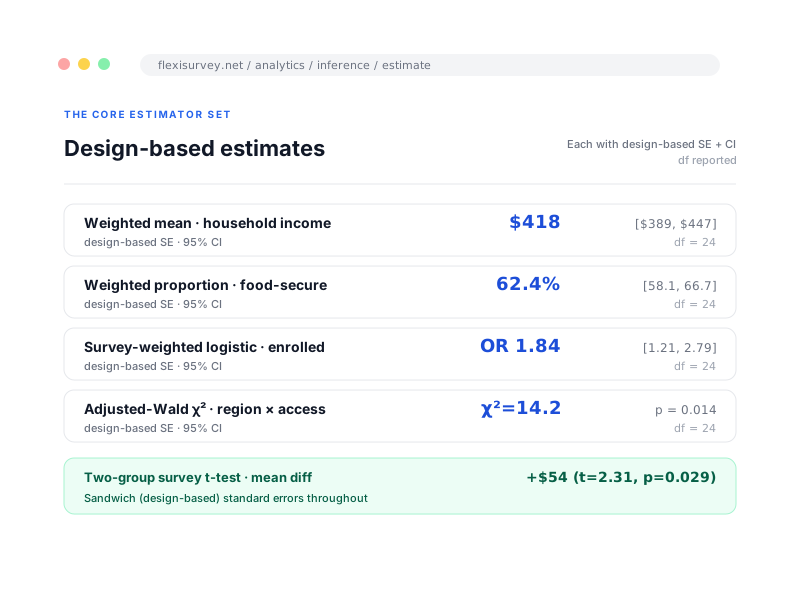
The supported, verified methods are weighted means and proportions, survey-weighted linear and logistic regression with design-based (sandwich) standard errors, an adjusted-Wald chi-square test of independence, and a two-group survey t-test. Every result carries its design-based standard error, confidence interval and degrees of freedom, ready for a report or a donor annex.
- Weighted means and proportions with design-based standard errors and confidence intervals
- Survey-weighted linear and logistic regression with design-based (sandwich) SEs
- Adjusted-Wald χ² test of independence and a two-group survey t-test
- Each result shows its standard error, confidence interval and degrees of freedom
Validate and disclose limitations
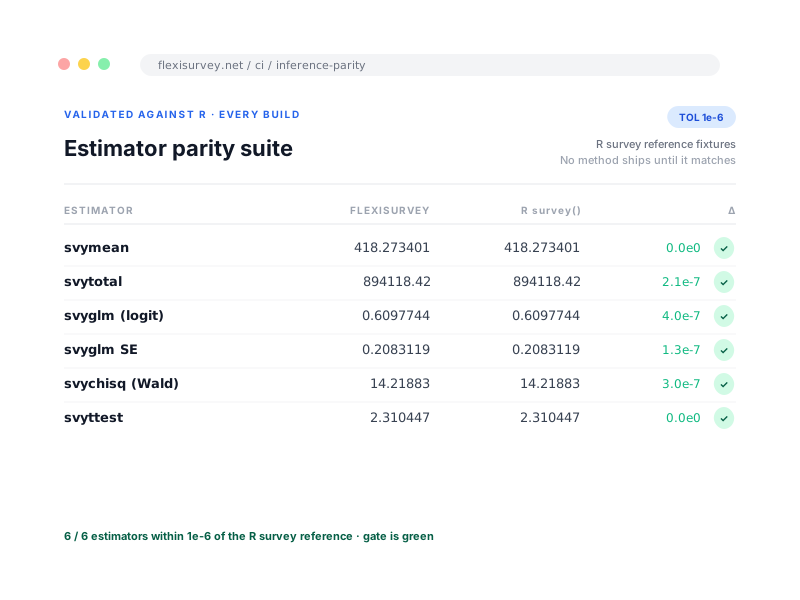
The bar for trusting a number is not that it returns a value, it is that it returns the same value as an established reference implementation. Each estimator is checked against versioned R `survey` reference fixtures on every build, to a 1e-6 tolerance, and no method ships until its fixture matches. We can share the methods note covering the package version, test datasets, tolerances, edge cases and known limitations on request.
- Checked against versioned R `survey` reference fixtures on every build
- 1e-6 tolerance; no method ships until its fixture matches
- Formulas derived from the `survey` reference, not approximated
- Methods note with versions, datasets, tolerances and limitations available on request
Keep analysis close to governed data
Tag a survey's design once, then run estimates from the Survey Statistics screen, with no separate stats package to license or learn. Computation runs on FlexiSurvey's own secure infrastructure and is never sent to an external statistics service, with a sovereign on-premise deployment available for Enterprise. "Explain these results" turns any estimate into a plain-language reading grounded in the actual numbers, and your R and Stata export stays available as an escape hatch.
- Run estimates from the Survey Statistics screen, no separate stats package
- Computed on FlexiSurvey's own infrastructure, never sent to a third-party service
- Sovereign on-premise deployment available for Enterprise
- "Explain these results" gives a grounded, plain-language reading of an estimate
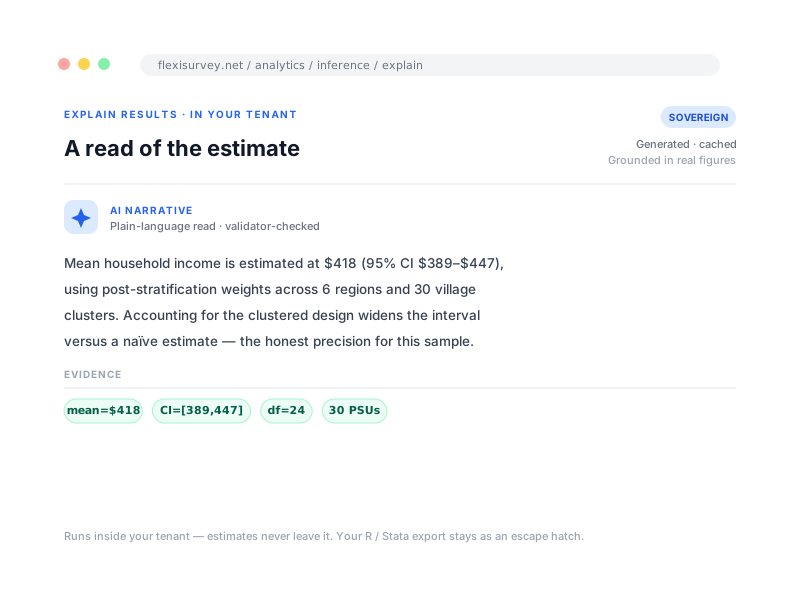
How it works
The typical flow from setup to output.
Tag your design
Point FlexiSurvey at the questions holding your sampling weight, stratum and cluster, or leave them blank for a simple random sample.
Choose an estimate
Pick a weighted mean, survey-weighted regression, χ² or t-test, and the variables to analyse.
Get design-correct numbers
A point estimate with its design-based standard error, confidence interval and degrees of freedom, validated against R.
Explain and report
Turn the result into a plain-language finding, then export it or roll it into a donor report.
Plays well with
Adjacent capabilities and solution pages you might want to read next.
Explore and clean your data first, form-aware profiling, descriptive summaries and fieldwork-integrity checks.
Donor-grade impact evaluations and complex-sample surveys, end to end.
Collect the weighted, clustered samples this analysis is built for, online and offline.
Request the methods note or a technical demonstration
Get design-correct survey inference where your data already lives. We can share the validation methods note and walk you through a weighted estimate on real data.
Talk to our team