Analytics and data quality
Understand the responses, and the fieldwork behind them
Explore results with denominators derived from the questionnaire, identify suspicious collection patterns, compare segments, and route findings to the people who need to act. For weighted, design-based estimation, see the inference engine.

Most survey tools hand you a stack of charts and leave the analysis to whatever you can rebuild in SPSS or a spreadsheet. FlexiSurvey reads the same form definition that collected the data, so it knows who each question was actually shown to and what kind of answer it expects. That form-awareness keeps your denominators honest, picks the right summary for each question type, and keeps Refused, Don't-know and N/A as distinct answers instead of folding them into your numbers.
This page owns exploration, descriptive analysis, data-quality review, open-text and driver analysis, and turning a finding into follow-up. Classical significance tests for simple samples (with effect sizes and assumption hints) sit alongside the exploration; weighted and design-based estimation, where strata and clusters change the variance, lives on its own inference page so the two are not confused.
What you can do
4 pillars, each one expanded further down with bullets and a screenshot.
Form-aware exploration
Denominators from the questionnaire, the right statistic per question type, segments and time.
Data-quality checks
Flags records that merit human review, without automatically labelling them invalid.
Text & drivers
Sentiment, themes and driver relationships as aids to review, with the AI model and limits disclosed.
Close-the-loop
Create a task or case from a response rule, assign an owner, track the deadline, push the event.
Analysis that understands survey routing
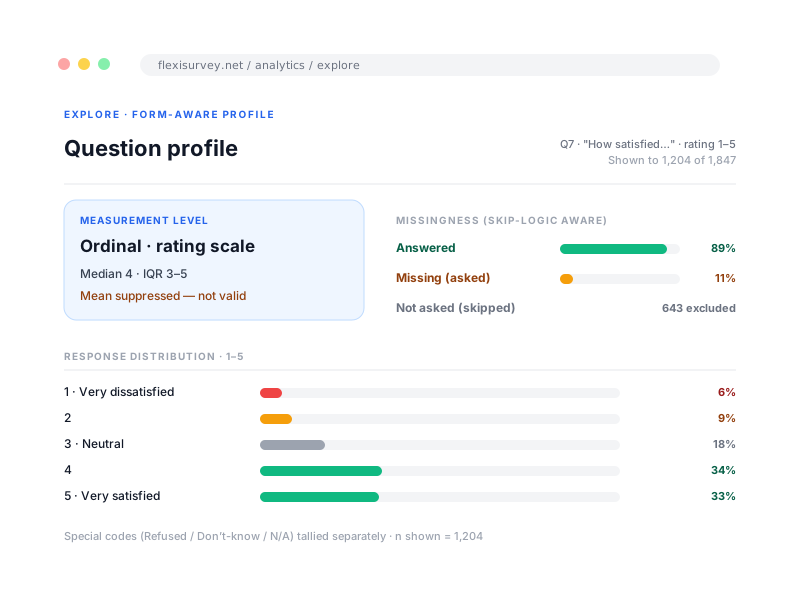
FlexiSurvey uses the instrument definition to distinguish a skipped question from a missing answer and to present summaries appropriate to the question type, so a 40% blank on a question only shown to a sub-group reads as not-asked rather than missing, and you are never offered a mean on a category or rating scale where one would mislead. Classical significance tests for simple samples are reported with effect sizes and assumption hints; for weighted, design-based estimation, see the inference engine.
- Frequencies and distributions
- Medians and ordered-response summaries
- Multi-select co-occurrence
- Segment and time comparison, with smart cross-tab suggestions
- Explicit treatment of Refused, Don't know and Not applicable
Review data quality before reporting
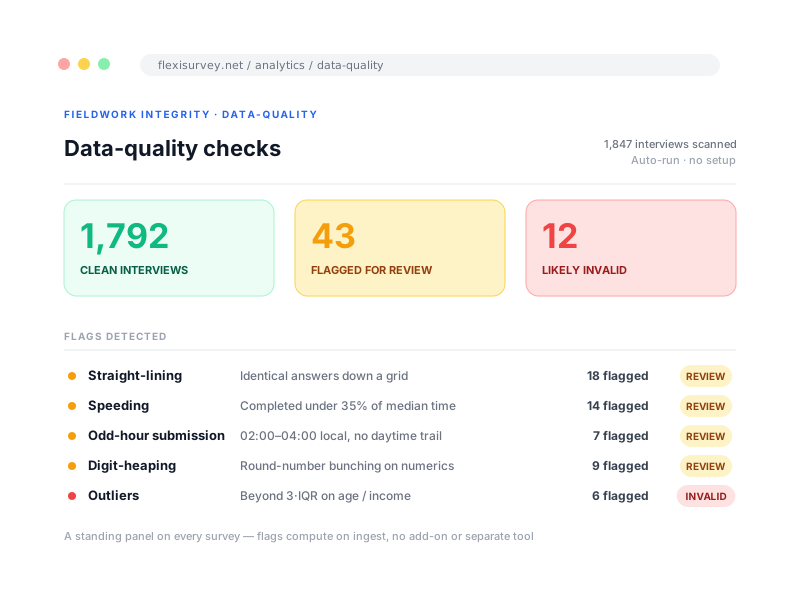
Field data is only as good as the fieldwork behind it. FlexiSurvey runs conservative integrity checks on every dataset and surfaces them as a standing panel, with no setup and no separate tool to buy, so reviewers and M&E leads can spot suspect cases before they are baked into a report rather than after a donor finds them. Flagged records are surfaced for review, not automatically marked invalid.
- Unusually short interviews
- Straight-lining or low-variance matrices
- Numeric outliers and digit heaping
- Duplicate or unusual submission patterns
- Enumerator, site and time comparisons
Analyse open text and key drivers
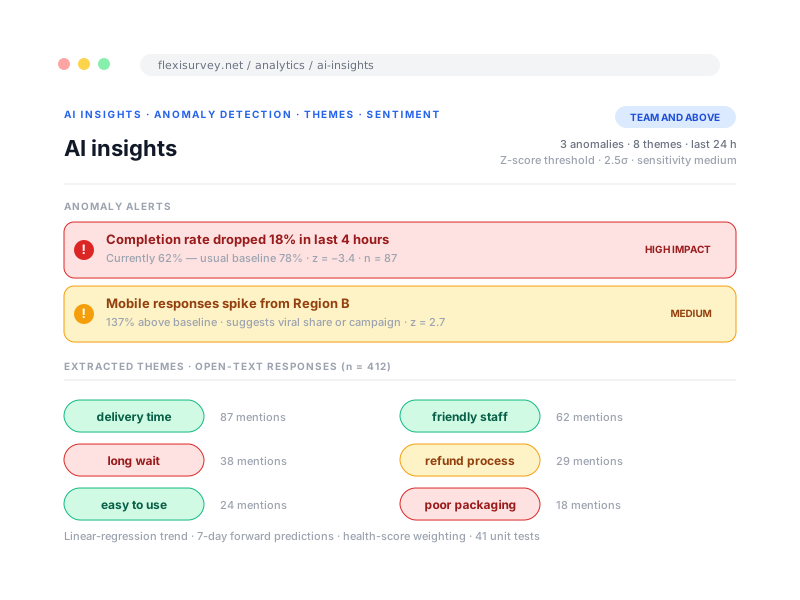
Surface sentiment, recurring themes and the drivers most associated with an outcome, such as the questions that move an NPS score, and present them as aids to review rather than automated conclusions. Where AI assistance is used, it is disclosed: narrative summaries are generated by Anthropic's Claude from de-identified, pre-aggregated result facts, never raw response rows, and every output is checked by a validator that rejects any number or claim the data did not support.
- Sentiment and theme extraction on open text
- Driver analysis, including what moves an NPS score, with segment comparison
- Plain-language "Explain these results", grounded in your figures and validated
- AI provider, data handling and limitations disclosed, not implied
Turn a finding into follow-up
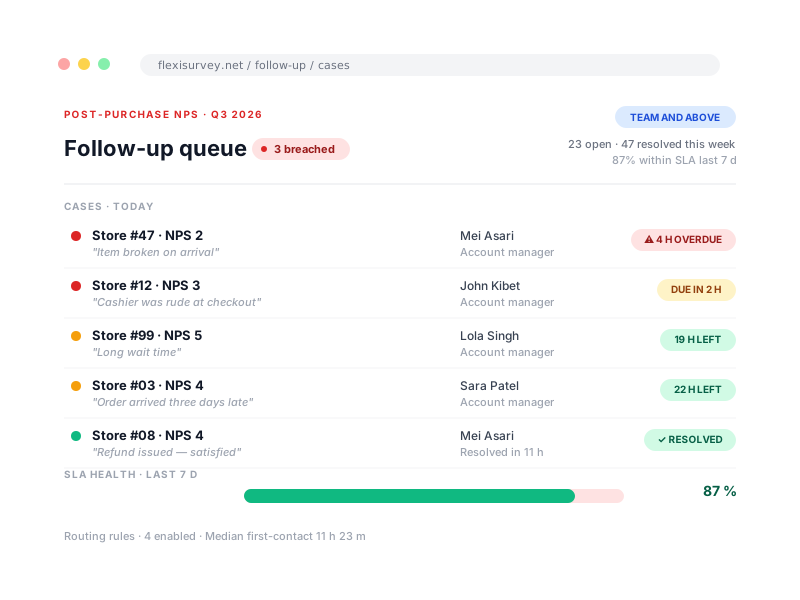
Analysis only matters if it changes something. Create a task or case from a response rule, assign an owner, track the deadline with reminders, and push the event to a connected system. Role-scoped dashboards mean a frontline owner sees only their own open cases while leadership sees the whole queue, the difference between measuring something and acting on it.
- Create a task or case from a response rule
- Assign an owner and track the deadline with reminders
- Push the event to your CRM or ticketing system over webhooks
- Role-scoped dashboards, frontline sees their own, leaders see the queue
How it works
The typical flow from setup to output.
Responses land
From web, mobile, SMS, QR or widget, all responses arrive in one place.
Analysis and quality checks run
Form-aware profiling, descriptive summaries, sentiment and data-quality flags compute with denominators that respect your skip logic.
Action gets assigned
Rules fire: a detractor to the CX lead, a low score to the store manager, open text mentioning "billing" to support.
Plays well with
Adjacent capabilities and solution pages you might want to read next.
Analyse a sample dataset with your own questionnaire logic
We will profile a sample survey live, honest missingness, the right statistic per question, data-quality flags, then run a close-the-loop finding end to end. About 20 minutes.
Talk to our team