Measure
Organisation planTrack change over time, rigorously
A single survey tells you where things stand. A longitudinal panel tells you what changed, for whom, and whether your sample still supports the claim. FlexiSurvey runs the whole study: panels, waves, variable lineage, attrition and analysis-ready exports, in the same platform that collects the data.
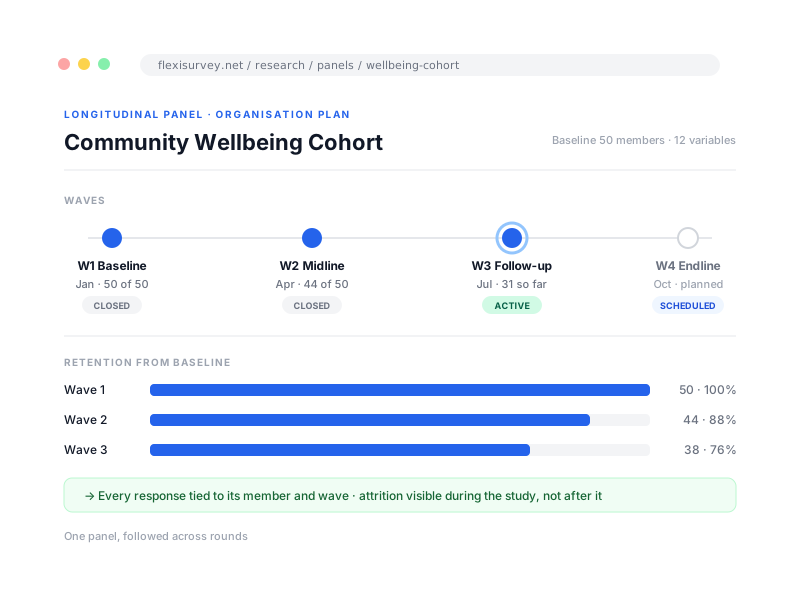
Most tools treat every survey as a fresh start, which leaves the hard parts of longitudinal work (keeping the sample consistent, keeping measures comparable, knowing who dropped out) to spreadsheets and discipline. FlexiSurvey makes the panel the unit of work: enrol members once, then follow them wave after wave with the platform tracking who answered what, in which round, against which instrument.
Because waves, variables and responses live together, the questions that matter in a longitudinal study have first-class answers. How is this measure trending? Who left after wave two, and did they differ from those who stayed? Which question fed this variable in each wave? When it is time to analyse, the data leaves as a documented, analysis-ready dataset rather than a pile of per-round exports.
What you can do
6 pillars, each one expanded further down with bullets and a screenshot.
Longitudinal panels and waves
Turn a panel into a longitudinal study: schedule waves, publish each round to members, and collect into one lineage.
Panel variables with lineage
Define study variables once and bind them to each wave's questions, so measures stay comparable as instruments evolve.
Cross-wave analytics
Trend any variable across waves, compare segments between rounds, and read summaries that treat the study as one dataset.
Attrition and retention
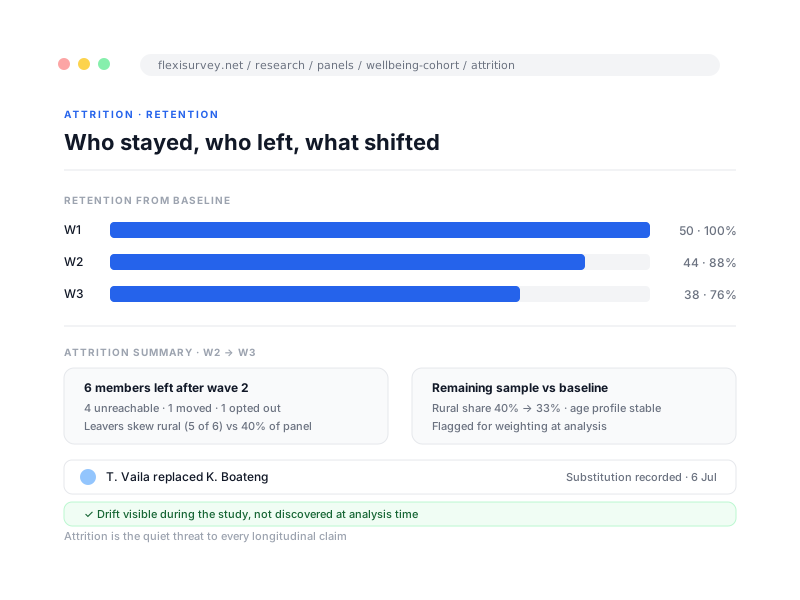
Retention tracked wave by wave, with attrition summaries that show who dropped out and how the remaining sample shifted.
Portfolio roll-up
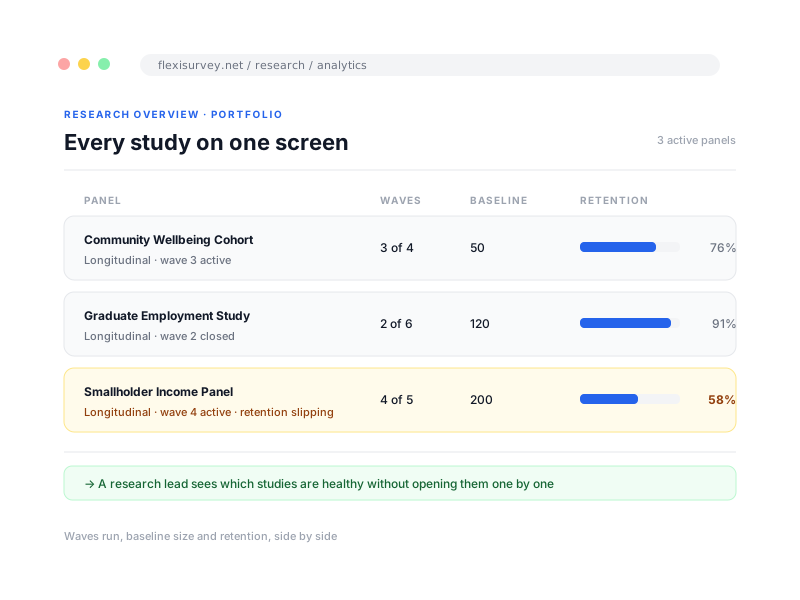
A research overview across all your panels: waves run, baseline sizes and latest retention, side by side.
Exports with a codebook
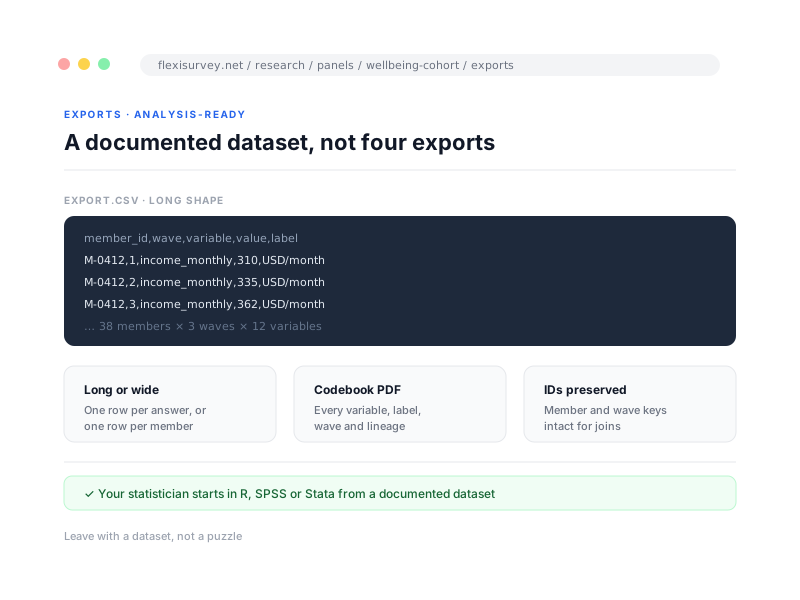
Analysis-ready CSV in long or wide shape, plus a codebook PDF documenting every variable, wave and label.
Run a panel across waves, not one-off surveys
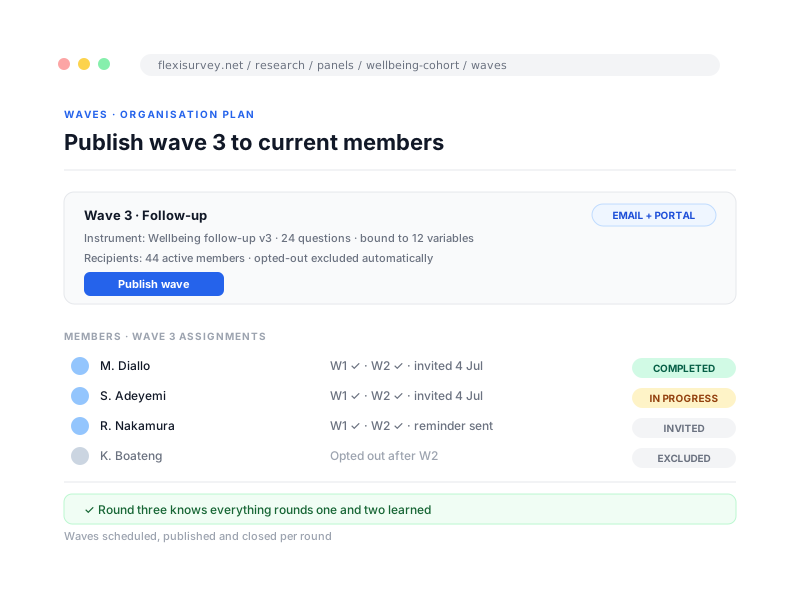
Mark a panel as longitudinal and it becomes a study you run in rounds. Each wave binds an instrument, publishes to current members as assignments and email invitations, and collects responses that stay attached to both the member and the wave, so round three knows everything rounds one and two learned.
- Waves scheduled, published and closed per round
- Members invited by email with per-wave assignments
- Every response tied to its member and wave
- Enrol by CSV import, with opt-outs respected
Keep measures comparable when instruments change
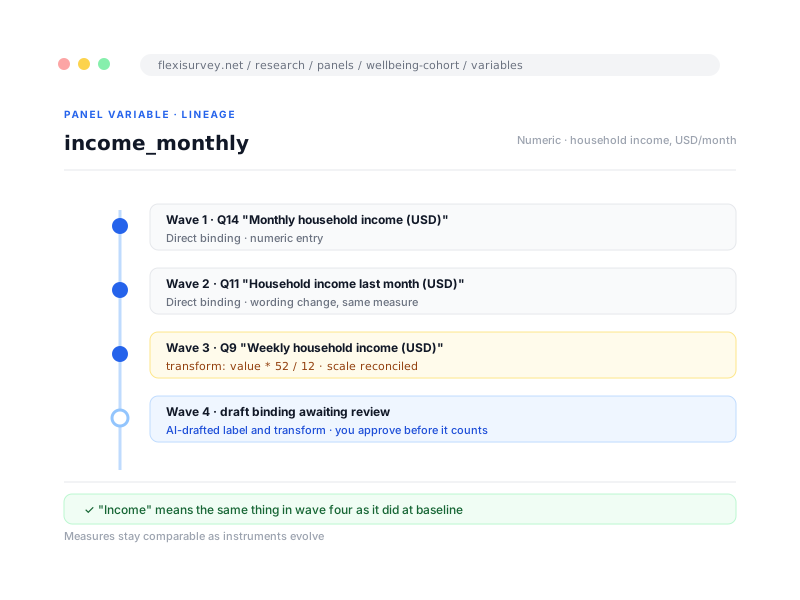
Questionnaires drift between rounds; your measures should not. Define panel variables once and bind each wave's question to them, with transforms to reconcile scale changes, so "household income" means the same thing in wave four as it did at baseline. AI can draft labels and transforms for review, and retired variables keep their history.
- Variables bound to each wave's questions
- Transforms reconcile scale and coding changes
- AI-drafted labels and transforms, reviewed by you
- Retired variables keep their lineage
See the trend, not four separate surveys
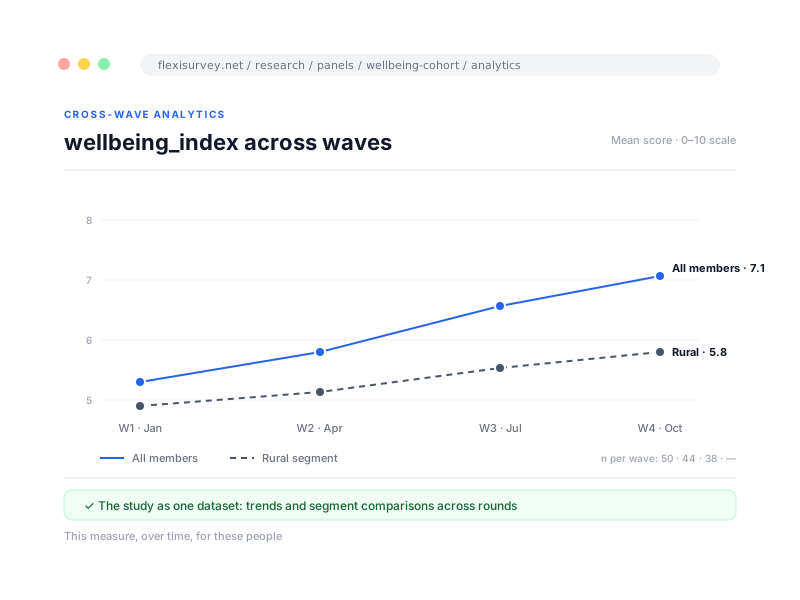
Cross-wave analytics treat the study as one dataset: trend any panel variable across rounds, compare segments between waves, and read study-level summaries without stitching exports together. The chart that matters in a longitudinal study (this measure, over time, for these people) is the default view, not an afterthought.
- Per-variable trends across all waves
- Segment comparison between rounds
- Study-level summaries, not per-survey silos
- Built on the same analytics suite as everything else
Know who you lost, and what it costs your claims
Attrition is the quiet threat to every longitudinal claim. FlexiSurvey tracks retention wave by wave and summarises who dropped out and how the remaining sample compares, so you can see drift as it happens rather than discover it at analysis time. Members can be replaced with the substitution recorded, not silently swapped.
- Retention rate per wave, from baseline
- Attrition summaries of who left and who stayed
- Replacements recorded against the original member
- Drift visible during the study, not after it
See every study on one screen
Teams rarely run one study. The research overview rolls every panel up to one screen: waves completed, baseline size and latest retention for each, so a research lead can see which studies are healthy and which need attention without opening them one by one.
- All panels on one overview
- Waves run, baseline size and retention per study
- Spot the study that needs attention
- Built for research leads, not just analysts
Leave with a dataset, not a puzzle
When collection ends, the study leaves as an analysis-ready dataset: CSV in long or wide shape, member and wave identifiers intact, plus a codebook PDF documenting every variable, its labels and its lineage. Your statistician starts from a documented dataset instead of reverse-engineering four exports.
- CSV in long or wide shape
- Member and wave identifiers preserved
- Codebook PDF of variables, labels and lineage
- Ready for R, SPSS, Stata or any stats tool
How it works
The typical flow from setup to output.
Enrol the panel
Create a longitudinal panel, import members by CSV, and define the study variables you intend to measure.
Run wave after wave
Bind each wave's instrument to your variables, publish to members, and watch retention as responses come in.
Analyse the study, export the dataset
Trend variables across waves, review attrition, then export long or wide CSV with a codebook PDF.
Plays well with
Adjacent capabilities and solution pages you might want to read next.
The panels and invitations that feed a longitudinal study.
Wave tracking with significance testing, and the rest of the suite.
Design-based estimates and tests, validated against R.
The research workflow this capability anchors.
Plan your first wave with us.
Tell us about your study: the cohort, the cadence and the measures, and we will walk the panel workflow end to end, from enrolment to codebook. About 20 minutes.
Talk to our team